OPEN-SOURCE SCRIPT
OG ATR Range
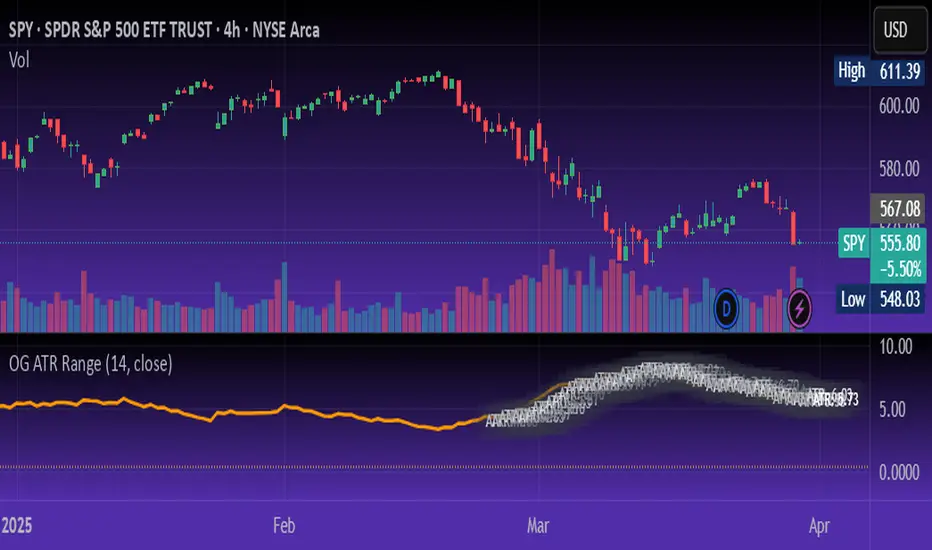
Description:
The OG ATR Tool is a clean, visualized version of the Average True Range indicator for identifying volatility, stop-loss levels, and realistic price movement expectations.
How it works:
Calculates the average range (in points/pips) of recent candles.
Overlays ATR bands to help define breakout potential or squeeze zones.
Can be used to size trades or set dynamic stop-loss and target levels.
Best for:
Intraday traders who want to avoid unrealistic targets.
Volatility-based setups and breakout strategies.
Creating position sizing rules based on instrument volatility.
Pro Tip: Combine with your trend indicators to set sniper entries and exits that respect volatility.
オープンソーススクリプト
TradingViewの精神に則り、このスクリプトの作者はコードをオープンソースとして公開してくれました。トレーダーが内容を確認・検証できるようにという配慮です。作者に拍手を送りましょう!無料で利用できますが、コードの再公開はハウスルールに従う必要があります。
免責事項
この情報および投稿は、TradingViewが提供または推奨する金融、投資、トレード、その他のアドバイスや推奨を意図するものではなく、それらを構成するものでもありません。詳細は利用規約をご覧ください。
オープンソーススクリプト
TradingViewの精神に則り、このスクリプトの作者はコードをオープンソースとして公開してくれました。トレーダーが内容を確認・検証できるようにという配慮です。作者に拍手を送りましょう!無料で利用できますが、コードの再公開はハウスルールに従う必要があります。
免責事項
この情報および投稿は、TradingViewが提供または推奨する金融、投資、トレード、その他のアドバイスや推奨を意図するものではなく、それらを構成するものでもありません。詳細は利用規約をご覧ください。