OPEN-SOURCE SCRIPT
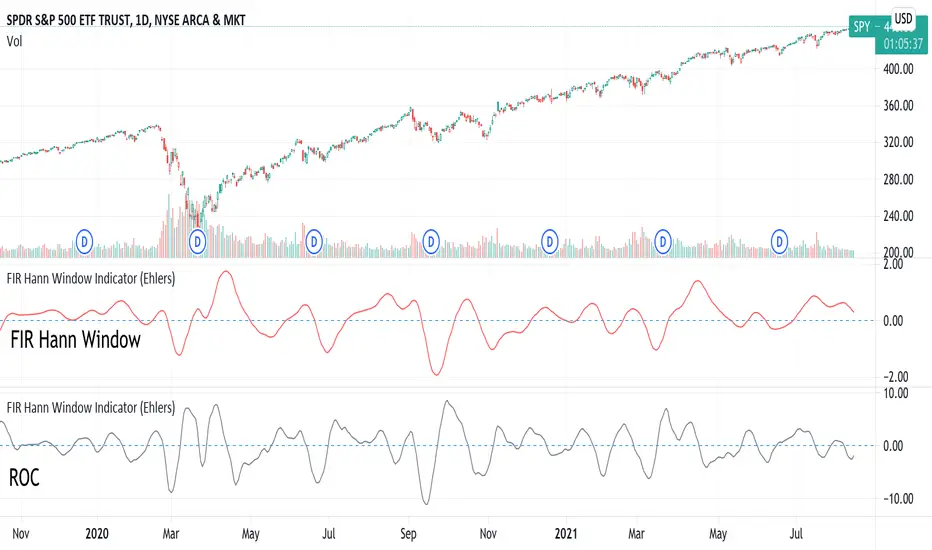
FIR Hann Window Indicator (Ehlers)
From Ehlers' Windowing article:
"A still-smoother weighting function that is easy to program is called the Hann window. The Hann window is often described as a “sine squared” distribution, although it is easier to program as a cosine subtracted from unity. The shape of the coefficient outline looks like a sinewave whose valleys are at the ends of the array and whose peak is at the center of the array. This configuration offers a smooth window transition from the smallest coefficient amplitude to the largest coefficient amplitude."
Ported from: { TASC SEP 2021 FIR Hann Window Indicator } (C) 2021 John F. Ehlers
Stocks & Commodities V. 39:09 (8–14, 23): Windowing by John F. Ehlers
Original code found here: traders.com/Documentation/FEEDbk_docs/2021/09/TradersTips.html
FIR Chart: traders.com/Documentation/FEEDbk_docs/2021/09/images/TT-Tradestation1.gif
ROC Chart: traders.com/Documentation/FEEDbk_docs/2021/09/images/TT-Tradestation1.gif
Ehlers style implementation mostly maintained for easy verification.
Added optional ROC display.
Style and efficiency updates + Hann windowing as a function coming soon.
Indicator added twice to chart show both FIR and ROC.
オープンソーススクリプト
TradingViewの精神に則り、このスクリプトの作者はコードをオープンソースとして公開してくれました。トレーダーが内容を確認・検証できるようにという配慮です。作者に拍手を送りましょう!無料で利用できますが、コードの再公開はハウスルールに従う必要があります。
免責事項
この情報および投稿は、TradingViewが提供または推奨する金融、投資、トレード、その他のアドバイスや推奨を意図するものではなく、それらを構成するものでもありません。詳細は利用規約をご覧ください。
オープンソーススクリプト
TradingViewの精神に則り、このスクリプトの作者はコードをオープンソースとして公開してくれました。トレーダーが内容を確認・検証できるようにという配慮です。作者に拍手を送りましょう!無料で利用できますが、コードの再公開はハウスルールに従う必要があります。
免責事項
この情報および投稿は、TradingViewが提供または推奨する金融、投資、トレード、その他のアドバイスや推奨を意図するものではなく、それらを構成するものでもありません。詳細は利用規約をご覧ください。