OPEN-SOURCE SCRIPT
更新済 Stablecoin supplies [USD bn]
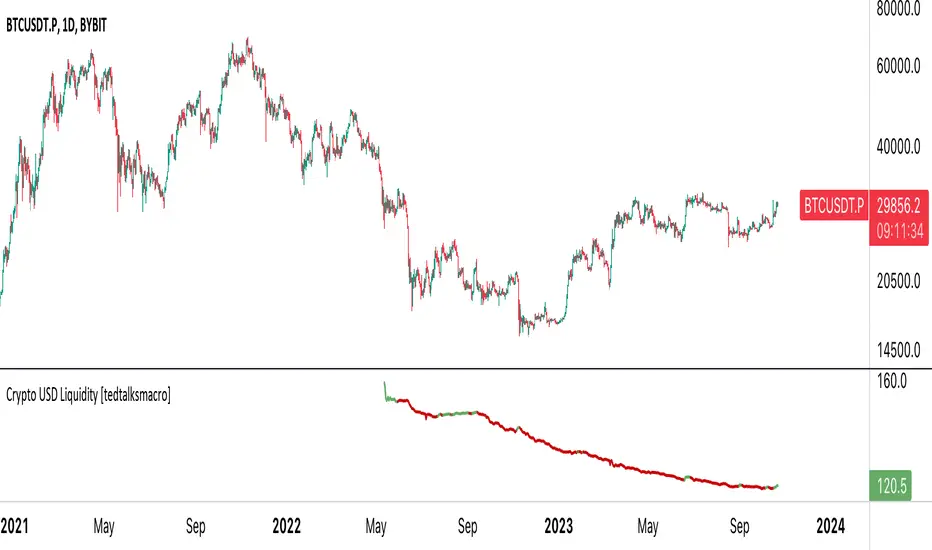
This script shows crypto market inflows/outflows by showing the USD stablecoin supplies, using data from https://glassnode.com/:
 BUSD_SUPPLY
 USDT_SUPPLY
 USDC_SUPPLY
Using a simple 20 EMA, the line will change color showing stablecoin inflow or outflow. Traders can consider stable coin inflows (green) as bullish for Bitcoin price, while stable coin outflows (red) should be considered bearish for price.
Using a simple 20 EMA, the line will change color showing stablecoin inflow or outflow. Traders can consider stable coin inflows (green) as bullish for Bitcoin price, while stable coin outflows (red) should be considered bearish for price.
リリースノート
Script title updateリリースノート
Designed to visualize the total liquidity of major stablecoins in the cryptocurrency market. The liquidity is calculated by summing the supply values of five leading stablecoins: USDT, BUSD, USDC, DAI, and TUSD. Based on the comparison of the current liquidity value with its EMA, the script colors the plotted line either green (when above the EMA) or red (when below the EMA), helping traders visually identify bullish or bearish liquidity trends.
オープンソーススクリプト
TradingViewの精神に則り、このスクリプトの作者はコードをオープンソースとして公開してくれました。トレーダーが内容を確認・検証できるようにという配慮です。作者に拍手を送りましょう!無料で利用できますが、コードの再公開はハウスルールに従う必要があります。
免責事項
この情報および投稿は、TradingViewが提供または推奨する金融、投資、トレード、その他のアドバイスや推奨を意図するものではなく、それらを構成するものでもありません。詳細は利用規約をご覧ください。
オープンソーススクリプト
TradingViewの精神に則り、このスクリプトの作者はコードをオープンソースとして公開してくれました。トレーダーが内容を確認・検証できるようにという配慮です。作者に拍手を送りましょう!無料で利用できますが、コードの再公開はハウスルールに従う必要があります。
免責事項
この情報および投稿は、TradingViewが提供または推奨する金融、投資、トレード、その他のアドバイスや推奨を意図するものではなく、それらを構成するものでもありません。詳細は利用規約をご覧ください。