The Stablecoin Dominance tool displays the evolution of the relative supply dominance of major stablecoins such as USDT, USDC, BUSD, DAI, and TUSD. Users can disable supported stablecoins to only show the supply dominance relative to the ones enabled. 🔶 USAGE The stablecoin space is subject to constant change due to new arriving stablecoins, regulation,...
Monitor the liquidity of the crypto market by tracking the capitalizations of the major Stablecoins. Stablecoin Liquidity (BSL) is an ideal tool for visualizing data on major Stablecoins. The number of Stablecoins in circulation is one of the best indices of liquidity within the crypto market. It’s an important metric to keep an eye on, as an increase in the...
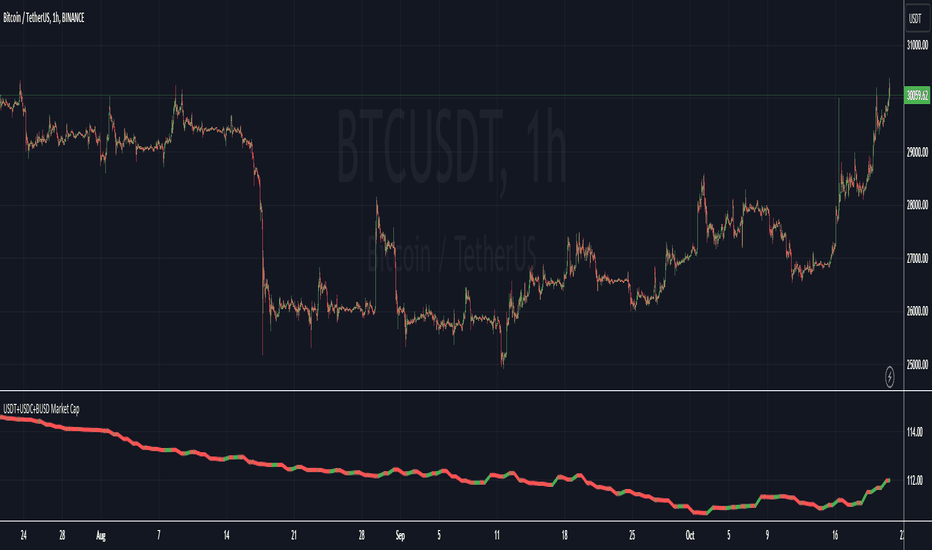
This Pine Script indicator visualizes the combined market capitalization of three prominent stablecoins: USDT, USDC, and BUSD, on a daily basis. It fetches the daily closing market caps of these stablecoins and sums them. The resulting line graph is displayed in its own separate pane below the main price chart. The line is color-coded: green on days when the...
The Stablecoin Supply Ratio Oscillator (SSRO) is a cryptocurrency indicator designed for mean reversion analysis and sentiment assessment. It calculates the ratio of CRYPTO:BTCUSD 's market capitalization to the sum of stablecoins' market capitalization and z-scores the result, offering insights into market sentiment and potential turning points. Methodology:...
A simple indicator that displays either the aggregated market cap of the top five stablecoins, or it displays all coins at once (look in the settings). Because of limitations with the sourced data the indicator only works on the daily timeframe or higher.
This script shows crypto market inflows/outflows by showing the USD stablecoin supplies, using data from glassnode.com : GLASSNODE:BUSD_SUPPLY GLASSNODE:USDT_SUPPLY GLASSNODE:USDC_SUPPLY Using a simple 20 EMA, the line will change color showing stablecoin inflow or outflow. Traders can consider stable coin inflows (green) as bullish for Bitcoin price,...
Stablecoins Dominance The purpose of the script is to show Stablecoin's strength in the crypto markets. 5 Largest Stablecoins divided by Total Market Cap
Altcoin Dominance (without ETH) Excluding Stablecoins Unsymetric The purpose of the script is to show Altcoin's strength without Ethereum once we exclude stablecoins. So we look into all altcoins besides eth and besides stablecoins divided by a value of eth+btc
ETH Dominance Excluding Stablecoins. The purpose of the script is to show Ethereum's strength relative to other cryptocurrencies. Pretty much shows ETH Dominance in comparison to Market Cap once we exclude the 5 largest stablecoins.
USDC and USDT combined Daily dominance, a good indicator for the amount of stablecoin volume ready to buy and support BTC & ETH
In this indicator you will find the sum of all stable coins (market cap) divided by the total crypto market cap. I believe there's a positive correlation between stable coins issuance and BTC's(and other coins) price appreciation. Or shortly put, to me the rising levels of stable coins represent increased levels of buying power (and adoption) waiting on the...
This simple indicator combines all the currently available stable-coin dominance values into one percentage; the first of its kind public on TradingView ! If trading view adds more in the future I will add them as well, and feel free to leave suggestions in the comments below :)
This indicator tracks the Market Caps of - USDT - USDC - DAI The data is presented on the RSI. The intent of this indicator is to help determine whether money is flowing into the market or not. If the major stablecoins are green, money is entering the market. The opposite applies, if red, money is leaving the market. This is another tool which may provide help...
![Stablecoin Dominance [LuxAlgo] BTCUSD: Stablecoin Dominance [LuxAlgo]](https://s3.tradingview.com/e/eFfvbyw1_mid.png)


![Stablecoin supplies [USD bn] BTCUSD: Stablecoin supplies [USD bn]](https://s3.tradingview.com/j/JNMLXipF_mid.png)


