OPEN-SOURCE SCRIPT
更新済 MVRVZ - MVRVZ Top and Bottom Indicator for BTC [Logue]
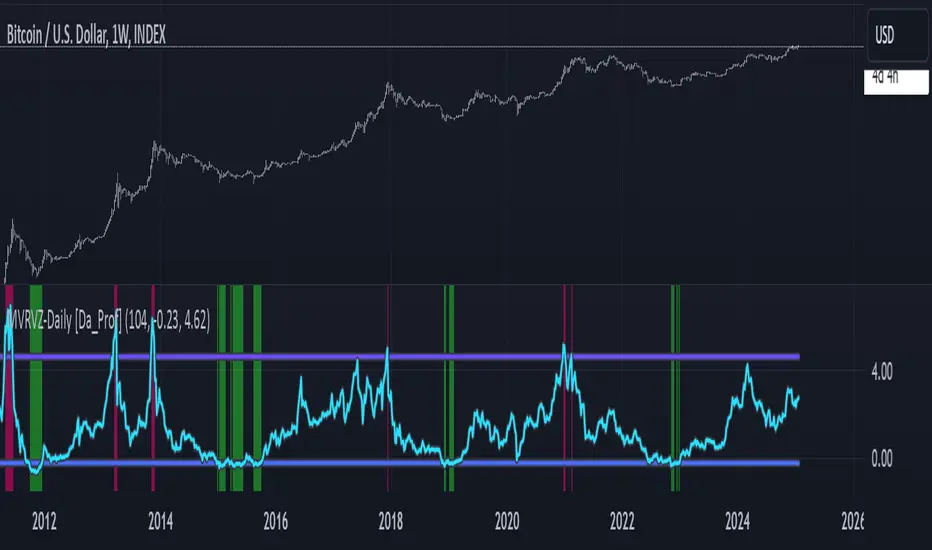
Market Value-Realized Value Z-score (MVRVZ) - The MVRV-Z score measures the value of the bitcoin network by comparing the market cap to the realized value and dividing by the standard deviation of the market cap (market cap – realized cap) / std(market cap)). When the market value is significantly higher than the realized value, the bitcoin network is "overvalued". Very high values have signaled cycle tops in the past and low values have signaled bottoms. For tops, the default trigger value is above 6.85. For bottoms, the indicator is triggered when the MVRVZ is below -0.25 (default).
リリースノート
This update changed the MVRV-Z to calculate on the weekly and to display consistently on lower timeframes. It used to collect all data from the beginning of the chart on the timeframe of the chart. This created inconsistency in the standard deviation calculation and ultimately the z-score calculation. The indicator now calculates based on the set number of weeks prior from the source data directly (default is two years worth of weekly data). This update now allows users to move between multiple timeframes and for all timeframes weekly or lower to show consistent values. リリースノート
Updated the top trigger line default to select for MVRVZ-BTC tops. リリースノート
Refined the top trigger line to better select for tops. オープンソーススクリプト
TradingViewの精神に則り、このスクリプトの作者はコードをオープンソースとして公開してくれました。トレーダーが内容を確認・検証できるようにという配慮です。作者に拍手を送りましょう!無料で利用できますが、コードの再公開はハウスルールに従う必要があります。
免責事項
この情報および投稿は、TradingViewが提供または推奨する金融、投資、トレード、その他のアドバイスや推奨を意図するものではなく、それらを構成するものでもありません。詳細は利用規約をご覧ください。
オープンソーススクリプト
TradingViewの精神に則り、このスクリプトの作者はコードをオープンソースとして公開してくれました。トレーダーが内容を確認・検証できるようにという配慮です。作者に拍手を送りましょう!無料で利用できますが、コードの再公開はハウスルールに従う必要があります。
免責事項
この情報および投稿は、TradingViewが提供または推奨する金融、投資、トレード、その他のアドバイスや推奨を意図するものではなく、それらを構成するものでもありません。詳細は利用規約をご覧ください。