OPEN-SOURCE SCRIPT
OS AO (P-unity MACD)
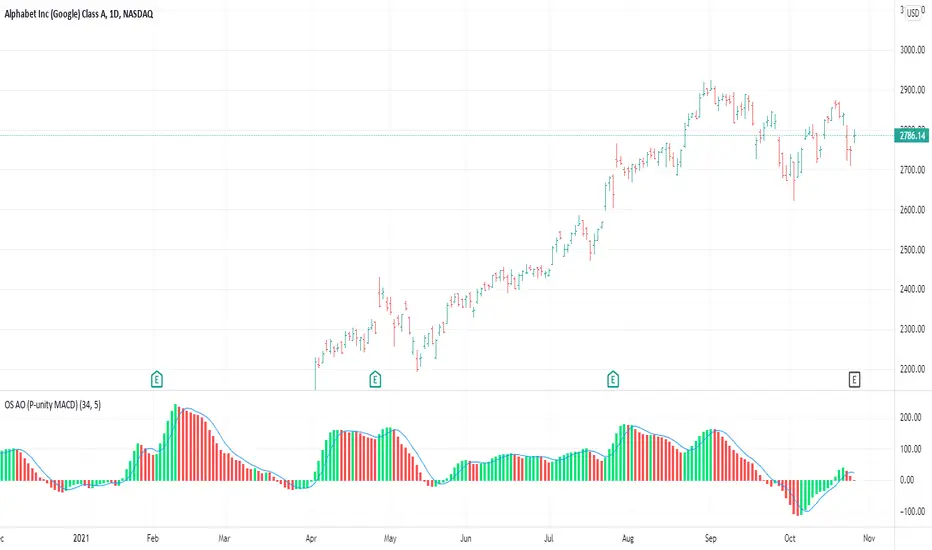
This is both the Awesome Oscillator (AO) as described in New Trading Dimensions ( NTD , book by Bill Williams ), and the Profitunity MACD described in the first edition of Trading Chaos.
The calculation for both is the same. In this case I added the 5 day SMA which is the blue line. The difference between the blue line and the AO is the AC which is also described in NTD and is usually plotted in a different indicator (AC).
This is the base for the following signals:
Zone Bar
2nd Wise Man
The signals are triggered and shown on the main chart screen through the use of OS Alligator . This indicator (AO) provides further insight in analyzing those signals by reading the AO, its current position and evolution directly.
オープンソーススクリプト
TradingViewの精神に則り、このスクリプトの作者はコードをオープンソースとして公開してくれました。トレーダーが内容を確認・検証できるようにという配慮です。作者に拍手を送りましょう!無料で利用できますが、コードの再公開はハウスルールに従う必要があります。
免責事項
この情報および投稿は、TradingViewが提供または推奨する金融、投資、トレード、その他のアドバイスや推奨を意図するものではなく、それらを構成するものでもありません。詳細は利用規約をご覧ください。
オープンソーススクリプト
TradingViewの精神に則り、このスクリプトの作者はコードをオープンソースとして公開してくれました。トレーダーが内容を確認・検証できるようにという配慮です。作者に拍手を送りましょう!無料で利用できますが、コードの再公開はハウスルールに従う必要があります。
免責事項
この情報および投稿は、TradingViewが提供または推奨する金融、投資、トレード、その他のアドバイスや推奨を意図するものではなく、それらを構成するものでもありません。詳細は利用規約をご覧ください。