OPEN-SOURCE SCRIPT
💸 Monetary Momentum Oscillator (MMO)
Monetary Momentum Oscillator (MMO)
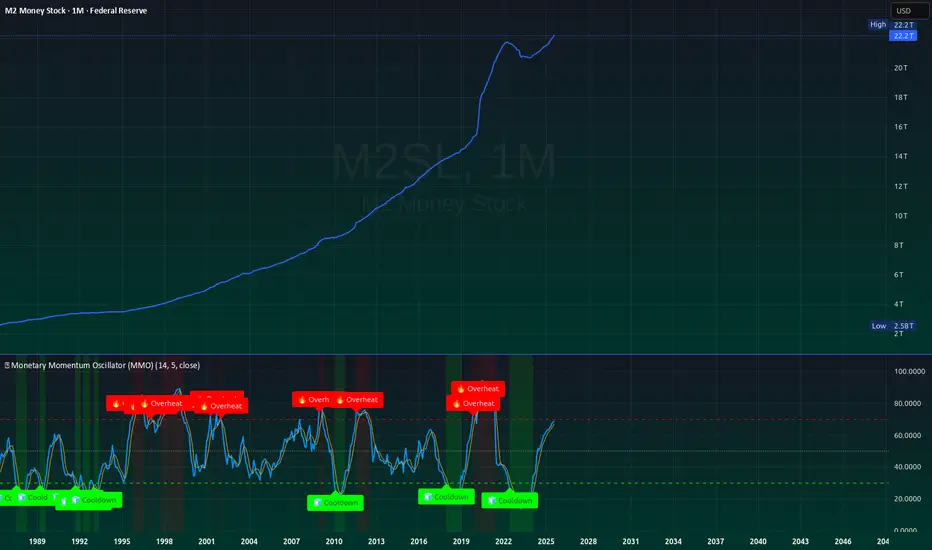
The Monetary Momentum Oscillator (MMO) measures the rate of change in the money supply (like M2, Fed Balance Sheet, or similar macro series) and applies a momentum-based RSI calculation to visualize liquidity acceleration and deceleration.
💡 Purpose:
MMO is designed for macro-level analysis — it identifies when monetary expansion is overheating (potential inflation or risk-on conditions) and when contraction is cooling off (liquidity tightening or deflationary stress).
📊 How It Works:
Calculates the percentage change of the selected data source over a chosen lookback period.
Applies an RSI transformation to visualize momentum extremes.
Overlays signal smoothing and highlights overheat/cooldown zones.
🔍 Interpretation:
Above 70 → Liquidity acceleration / overheating (potential inflationary impulse).
Below 30 → Liquidity deceleration / contraction (risk-off, tightening).
Crossovers → Momentum shifts that often precede macro trend reversals in risk assets.
⚙️ Best Used On:
Macroeconomic series such as M2SL, M2V, WALCL, or custom liquidity indexes.
Long-term charts (weekly or monthly) for detecting major monetary regime transitions.
🧩 Core Idea:
Liquidity is the real market engine — this oscillator quantifies its pulse.
オープンソーススクリプト
TradingViewの精神に則り、この作者はスクリプトのソースコードを公開しているので、その内容を理解し検証することができます。作者に感謝です!無料でお使いいただけますが、このコードを投稿に再利用する際にはハウスルールに従うものとします。
免責事項
これらの情報および投稿は、TradingViewが提供または保証する金融、投資、取引、またはその他の種類のアドバイスや推奨を意図したものではなく、またそのようなものでもありません。詳しくは利用規約をご覧ください。
オープンソーススクリプト
TradingViewの精神に則り、この作者はスクリプトのソースコードを公開しているので、その内容を理解し検証することができます。作者に感謝です!無料でお使いいただけますが、このコードを投稿に再利用する際にはハウスルールに従うものとします。
免責事項
これらの情報および投稿は、TradingViewが提供または保証する金融、投資、取引、またはその他の種類のアドバイスや推奨を意図したものではなく、またそのようなものでもありません。詳しくは利用規約をご覧ください。