OPEN-SOURCE SCRIPT
更新済 RSI Moving Average Crossovers

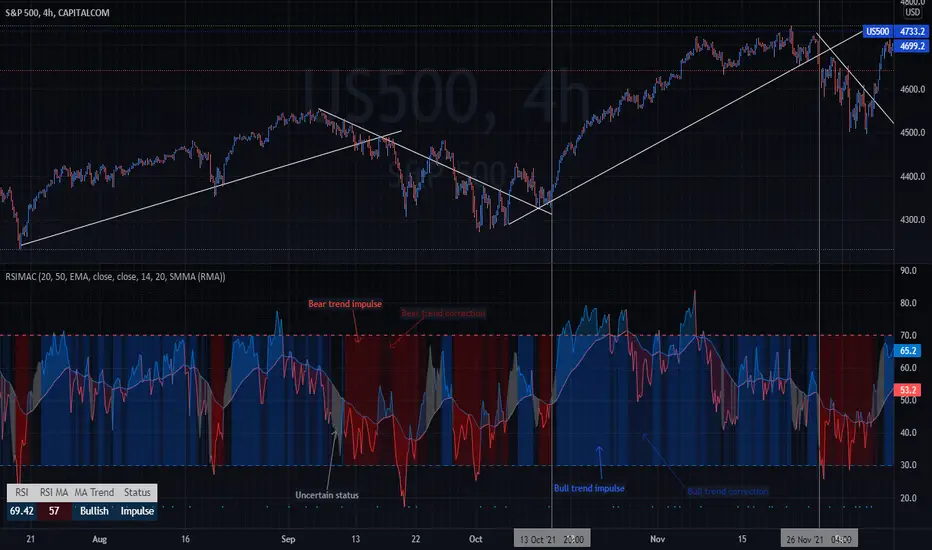
This script is an improved version of the RSI indicator, using a moving average on the RSI itself, as well as two other moving averages used to determine the current trend.
A small screener indicating the current movement is displayed in the bottom-left zone of the chart: trend (Bullish/Bearish/Uncertain) and status (Impulse or Correction)
Trends are simply based on moving averages crossovers, coupled to the fact that the current candle closes above the fast MA in a bull trend, and under the fast MA in a bear trend. In other cases, the trend and the movement are considered as "Uncertain" by the indicator.
Options
Defaults Parameters
Don't hesitate to suggest any idea which could improve this indicator.
A small screener indicating the current movement is displayed in the bottom-left zone of the chart: trend (Bullish/Bearish/Uncertain) and status (Impulse or Correction)
Trends are simply based on moving averages crossovers, coupled to the fact that the current candle closes above the fast MA in a bull trend, and under the fast MA in a bear trend. In other cases, the trend and the movement are considered as "Uncertain" by the indicator.
Options
- Various types of moving averages for the RSI and trend MA
- Show/Hide crossovers between the RSI and its MA
- Color the RSI normal zone with the current trend/movement colors
- Show/Hide the screener indicating the current movement
Defaults Parameters
- Fast MA 20
- Slow MA 50
- MA source: Close
- RSI Length 14
- RSI MA: SMMA (RMA)
- RSI MA Length: 20
Don't hesitate to suggest any idea which could improve this indicator.
リリースノート
Updates- Trend moving average crossovers are now displayed as xcrosses on the indicator (can be disabled)
- Overbought and oversold levels can be modified in options
リリースノート
moving average crosses title modified リリースノート
50% line addedオープンソーススクリプト
TradingViewの精神に則り、このスクリプトの作者はコードをオープンソースとして公開してくれました。トレーダーが内容を確認・検証できるようにという配慮です。作者に拍手を送りましょう!無料で利用できますが、コードの再公開はハウスルールに従う必要があります。
免責事項
この情報および投稿は、TradingViewが提供または推奨する金融、投資、トレード、その他のアドバイスや推奨を意図するものではなく、それらを構成するものでもありません。詳細は利用規約をご覧ください。
オープンソーススクリプト
TradingViewの精神に則り、このスクリプトの作者はコードをオープンソースとして公開してくれました。トレーダーが内容を確認・検証できるようにという配慮です。作者に拍手を送りましょう!無料で利用できますが、コードの再公開はハウスルールに従う必要があります。
免責事項
この情報および投稿は、TradingViewが提供または推奨する金融、投資、トレード、その他のアドバイスや推奨を意図するものではなく、それらを構成するものでもありません。詳細は利用規約をご覧ください。