OPEN-SOURCE SCRIPT
3-10 MA Oscillator (Wyckoff) by malagadev
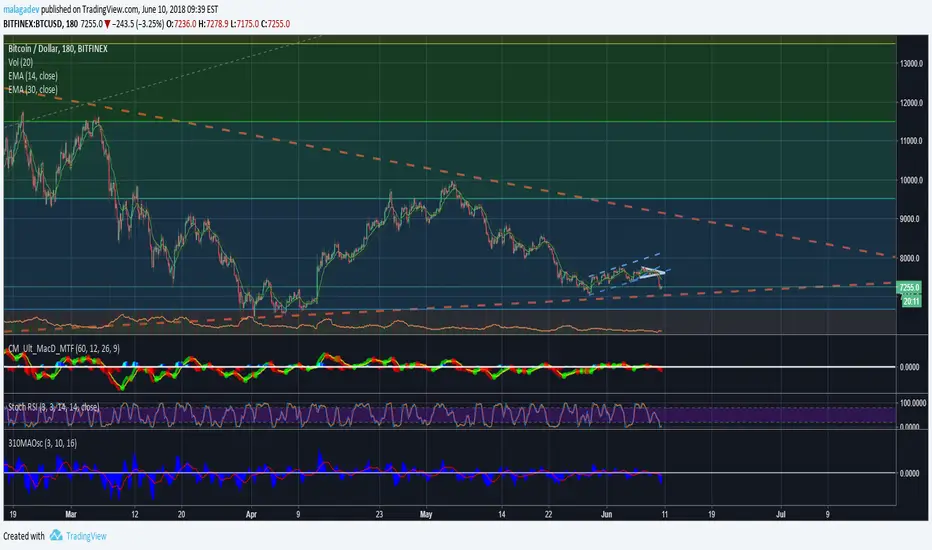
- If ControlSMA(16) [red line] exceeds 0 means market is bullish, below 0 means market is bearish.
- Difference between SMA(3,10) is represented with blue area.
- You can operate using changes in color or trend, or simply knowing that once 0 is crossed upwards, it means the pullback is proportional so we just need a simple pattern in the price or, entering after it just crosses.
- It's better to open positions in the first pullback after the ControlSMA(16) firstly crosses 0 ("First Cross").
- It's possible to operate using momentum divergences.
オープンソーススクリプト
TradingViewの精神に則り、このスクリプトの作者はコードをオープンソースとして公開してくれました。トレーダーが内容を確認・検証できるようにという配慮です。作者に拍手を送りましょう!無料で利用できますが、コードの再公開はハウスルールに従う必要があります。
免責事項
この情報および投稿は、TradingViewが提供または推奨する金融、投資、トレード、その他のアドバイスや推奨を意図するものではなく、それらを構成するものでもありません。詳細は利用規約をご覧ください。
オープンソーススクリプト
TradingViewの精神に則り、このスクリプトの作者はコードをオープンソースとして公開してくれました。トレーダーが内容を確認・検証できるようにという配慮です。作者に拍手を送りましょう!無料で利用できますが、コードの再公開はハウスルールに従う必要があります。
免責事項
この情報および投稿は、TradingViewが提供または推奨する金融、投資、トレード、その他のアドバイスや推奨を意図するものではなく、それらを構成するものでもありません。詳細は利用規約をご覧ください。