OPEN-SOURCE SCRIPT
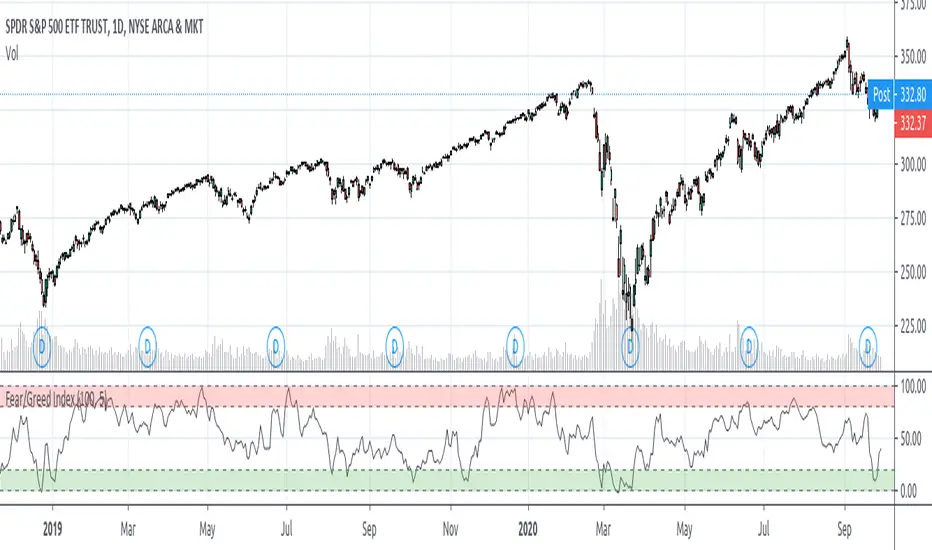
Fear/Greed Index

My goal was to create something akin to the Fear & Greed Index (https://money.cnn.com/data/fear-and-greed/) that CNN and others do.
A Fear/Greed Index can be used by any trader or investor but I believe it's best viewed with a contrarian's eye--
The script draws from several other tickers which I have read and personally observed to be decent macro correlations for the stock market (specifically the SP500). For the state of each of these metrics I gave a rating, good or bad, then added them together and put it into your standard Stochastic.
These macro correlations include--
A Fear/Greed Index can be used by any trader or investor but I believe it's best viewed with a contrarian's eye--
- When the market appears to be signalling Extreme Fear, that is a good place to start buying from emotional players who want to sell no matter the price
- When signalling Extreme Greed, that may be a good place to start taking profits off or getting hedged, as there may be too much exuberance in the air
- Important to note and remember, however, is that there can often times be fear in the air for good reasons! I like to see this as if we dip into extreme fear and return shortly after, the fear may warrant constraint from buying, or returning back to extreme greed may be a very strong market extension
The script draws from several other tickers which I have read and personally observed to be decent macro correlations for the stock market (specifically the SP500). For the state of each of these metrics I gave a rating, good or bad, then added them together and put it into your standard Stochastic.
These macro correlations include--
- The % of stocks in the SP500 above multiple Simple Moving Average lengths
- VIX and its term-structure (contango, backwardation)
- Treasury Bonds
- Gold
- Junk/High Yield Bonds
- The Put/Call Ratio
- The SP500 Options Skew
- Advancing and Declining Issues
On some of these I opted to use a function for the Relative Momentum Index instead of RSI, as the RMI oscillates better (in my opinion). I also used a Band-Pass Filter/Double EMA for smoothing the results of the stochastic.
A LOT of these numbers were made to my own observation and discretion and can get out-dated over time. With that said, PLEASE feel free to revise, fine tune, modify this as you wish to optimize yours. And please let me know if I have made any mistakes here or something should be added.
オープンソーススクリプト
TradingViewの精神に則り、このスクリプトの作者はコードをオープンソースとして公開してくれました。トレーダーが内容を確認・検証できるようにという配慮です。作者に拍手を送りましょう!無料で利用できますが、コードの再公開はハウスルールに従う必要があります。
免責事項
この情報および投稿は、TradingViewが提供または推奨する金融、投資、トレード、その他のアドバイスや推奨を意図するものではなく、それらを構成するものでもありません。詳細は利用規約をご覧ください。
オープンソーススクリプト
TradingViewの精神に則り、このスクリプトの作者はコードをオープンソースとして公開してくれました。トレーダーが内容を確認・検証できるようにという配慮です。作者に拍手を送りましょう!無料で利用できますが、コードの再公開はハウスルールに従う必要があります。
免責事項
この情報および投稿は、TradingViewが提供または推奨する金融、投資、トレード、その他のアドバイスや推奨を意図するものではなく、それらを構成するものでもありません。詳細は利用規約をご覧ください。