OPEN-SOURCE SCRIPT
更新済 O'Neil Earnings Stability
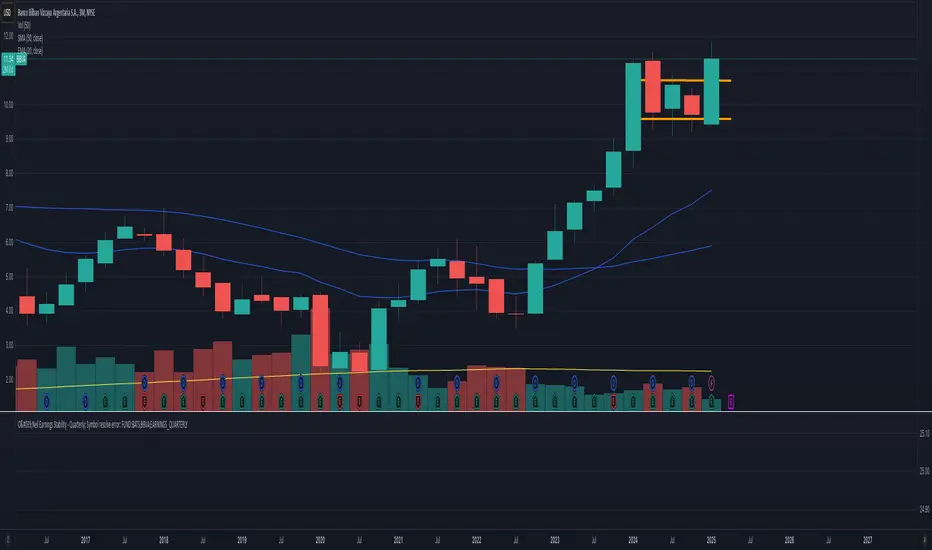
O'Neil Earnings Stability Indicator
This indicator implements William O'Neil's earnings stability analysis, a key factor in identifying high-quality growth stocks. It measures both earnings stability (1-99 scale) and growth rate.
Scale Interpretation:
• 1-25: Highly stable earnings (ideal)
• 26-30: Moderately stable
• >30: More cyclical/less dependable
The stability score is calculated by measuring deviations from the earnings trend line, with lower scores indicating more consistent growth. Combined with the annual growth rate (target ≥25%), this helps identify stocks with both steady and strong earnings growth.
Optimal Criteria:
✓ Stability Score < 25
✓ Annual Growth > 25%
This tool helps filter out stocks with erratic earnings patterns and identify those with proven, sustainable growth records. Green label indicates both criteria are met; red indicates one or both criteria failed."
Would you like me to modify any part of this description or add more details about specific aspects of the calculation?
The key concepts in these calculations:
Stability Score (1-99 scale):
Lower score = more stable
Takes average deviation from mean earnings
Uses logarithmic scaling to emphasize smaller deviations
Multiplies by 20 to get into 1-99 range
Score ≤ 25 meets O'Neil's criteria
Growth Rate:
Year-over-year comparison (current quarter vs same quarter last year)
Calculated as percentage change
Growth ≥ 25% meets O'Neil's criteria
O'Neil's Combined Criteria:
Stability Score should be ≤ 25 (indicating stable earnings)
Growth Rate should be ≥ 25% (indicating strong growth)
Both must be met for ideal conditions
リリースノート
- updating script to stay static with earnings calculations not based on intervals selectedオープンソーススクリプト
TradingViewの精神に則り、このスクリプトの作者はコードをオープンソースとして公開してくれました。トレーダーが内容を確認・検証できるようにという配慮です。作者に拍手を送りましょう!無料で利用できますが、コードの再公開はハウスルールに従う必要があります。
免責事項
この情報および投稿は、TradingViewが提供または推奨する金融、投資、トレード、その他のアドバイスや推奨を意図するものではなく、それらを構成するものでもありません。詳細は利用規約をご覧ください。
オープンソーススクリプト
TradingViewの精神に則り、このスクリプトの作者はコードをオープンソースとして公開してくれました。トレーダーが内容を確認・検証できるようにという配慮です。作者に拍手を送りましょう!無料で利用できますが、コードの再公開はハウスルールに従う必要があります。
免責事項
この情報および投稿は、TradingViewが提供または推奨する金融、投資、トレード、その他のアドバイスや推奨を意図するものではなく、それらを構成するものでもありません。詳細は利用規約をご覧ください。