OPEN-SOURCE SCRIPT
更新済 EMR Strategy [H1 Backtesting]

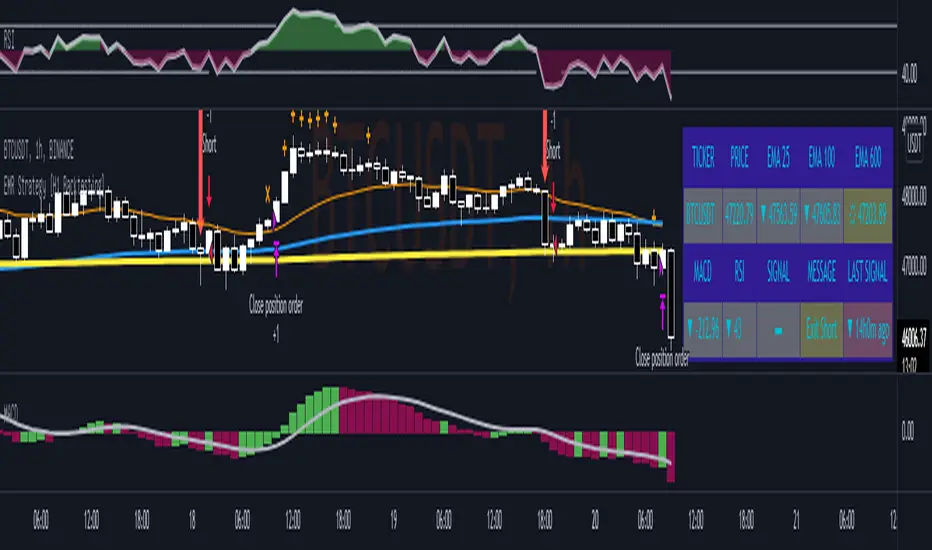
EMR Strategy base on EMA, MACD and RSI to supply signal on time frame H1.
Details of Rule as below:
===
1.EMA
+ Time frame: H1
+ Periods: 25, 100 (~ EMA 25 H4), 600 (~ EMA 25 D1)
===
2.MACD
+ Time frame: H1
+ Periods: 12,26,9
===
3.RSI
+ Time frame: H1
+ Periods: 14
===
4.Trading Rule
4.1.Long Position
+ MACD>0 and RSI>50 and close price moving above EMA 25
+ Close price crossed EMA 100 or crossed EMA 600 at the first time
4.2.Short Position
+ MACD<0 and RSI<50 and close price moving below EMA 25
+ Close price crossed EMA 100 or crossed EMA 600 at the first time
===
5.Money Management
+ This strategy concentrate into winrate.
+ So use trailing stop to protect your profits.
+ And use stoploss to avoid big loss on trades.
リリースノート
Update funtion backtest at line 175 and 176リリースノート
Update Table of Infomation and Exit Position Rule4.3.Exit Position
+ Exit Long Position when High Price moving below all 3 EMA
+ Exit Long Position when RSI over 70
+ Exit Short Position when Low Price moving above all 3 EMA
+ Exit Short Position when RSI under 30
リリースノート
Update Input RSI Overbought and Oversold Level, and Rule of Exit Position.4.3.Exit Position
+ Exit Long Position when High Price moving below all 3 EMA
+ Exit Long Position when RSI overbought and EMA25>EMA100 or EMA25>EMA600
+ Exit Short Position when Low Price moving above all 3 EMA
+ Exit Short Position when RSI oversold and EMA25<EMA100 or EMA25<EMA600
オープンソーススクリプト
TradingViewの精神に則り、このスクリプトの作者はコードをオープンソースとして公開してくれました。トレーダーが内容を確認・検証できるようにという配慮です。作者に拍手を送りましょう!無料で利用できますが、コードの再公開はハウスルールに従う必要があります。
免責事項
この情報および投稿は、TradingViewが提供または推奨する金融、投資、トレード、その他のアドバイスや推奨を意図するものではなく、それらを構成するものでもありません。詳細は利用規約をご覧ください。
オープンソーススクリプト
TradingViewの精神に則り、このスクリプトの作者はコードをオープンソースとして公開してくれました。トレーダーが内容を確認・検証できるようにという配慮です。作者に拍手を送りましょう!無料で利用できますが、コードの再公開はハウスルールに従う必要があります。
免責事項
この情報および投稿は、TradingViewが提供または推奨する金融、投資、トレード、その他のアドバイスや推奨を意図するものではなく、それらを構成するものでもありません。詳細は利用規約をご覧ください。