INVITE-ONLY SCRIPT
更新済 Volume Analysis Tool - CryptoShoots

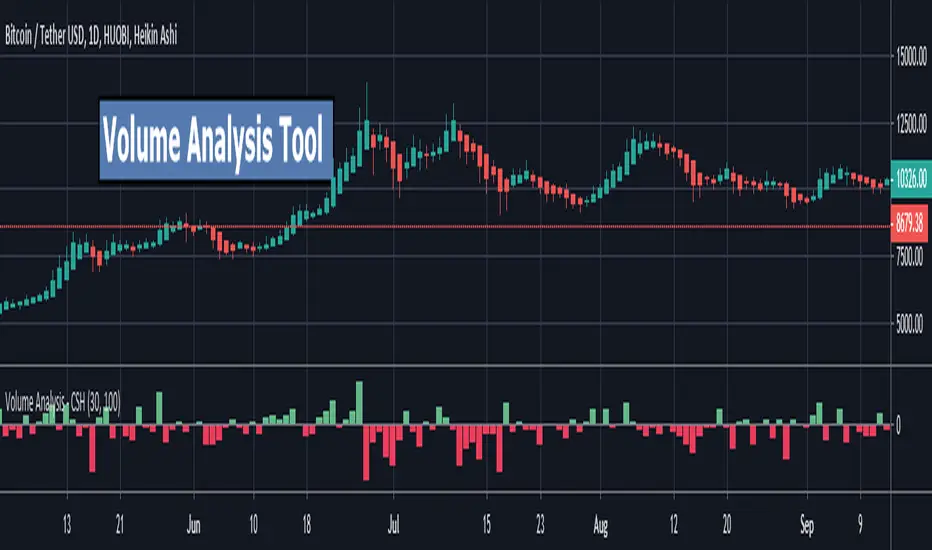
Volume Analysis Tool
Volume Analysis Tool is a technique to simulate tick volume data to get Buying volume and Selling Volume in each bar to any asset .
*** Features
* Delta Volume Mode .
* Detailed Volume mode - Buying and selling for each candle .
* Better understanding to the Accumulation and Distribution using volume analysis easily .
*** Usage
* Turn only one Mode(Delta or Detailed ) ON to let the indicator Shows you its magic .
* Volume Search : by default it's 1 MIN . Note : if you want to change the value understand that the lower the value the better the Accuracy .
//
As a rule of thump use 1 MIN Volume Search for these time frames ( from 5 min to 4 hours ) and 5 min Volume Search for Daily time frame .
リリースノート
Cumulative Delta has been added to the tool now .What is Cumulative Delta?
Delta refers to the net difference between buying and selling volume at each price level. Cumulative Delta builds upon this concept by recording a cumulative tally of these differences in buying vs selling volume.
*Using the Cumulative Delta Indicator
The Cumulative Delta indicator plots as candlesticks in a panel below the price at time information. One of the main uses of Cumulative Delta is to confirm or deny market trends.
リリースノート
This version has been updated its algorithm to calculate Whales aggressive buy and Whales agressive sellers , Whales are the reason for any action than normal buying and selling . 招待専用スクリプト
このスクリプトは作者が承認したユーザーのみアクセス可能です。使用するにはアクセス申請をして許可を得る必要があります。通常は支払い後に承認されます。詳細は下記の作者の指示に従うか、CryptoShootsに直接お問い合わせください。
TradingViewは、作者を完全に信頼し、スクリプトの動作を理解していない限り、有料スクリプトの購入・使用を推奨しません。コミュニティスクリプトには無料のオープンソースの代替が多数あります。
作者の指示
免責事項
この情報および投稿は、TradingViewが提供または推奨する金融、投資、トレード、その他のアドバイスや推奨を意図するものではなく、それらを構成するものでもありません。詳細は利用規約をご覧ください。
招待専用スクリプト
このスクリプトは作者が承認したユーザーのみアクセス可能です。使用するにはアクセス申請をして許可を得る必要があります。通常は支払い後に承認されます。詳細は下記の作者の指示に従うか、CryptoShootsに直接お問い合わせください。
TradingViewは、作者を完全に信頼し、スクリプトの動作を理解していない限り、有料スクリプトの購入・使用を推奨しません。コミュニティスクリプトには無料のオープンソースの代替が多数あります。
作者の指示
免責事項
この情報および投稿は、TradingViewが提供または推奨する金融、投資、トレード、その他のアドバイスや推奨を意図するものではなく、それらを構成するものでもありません。詳細は利用規約をご覧ください。