OPEN-SOURCE SCRIPT
Normalized ROC²
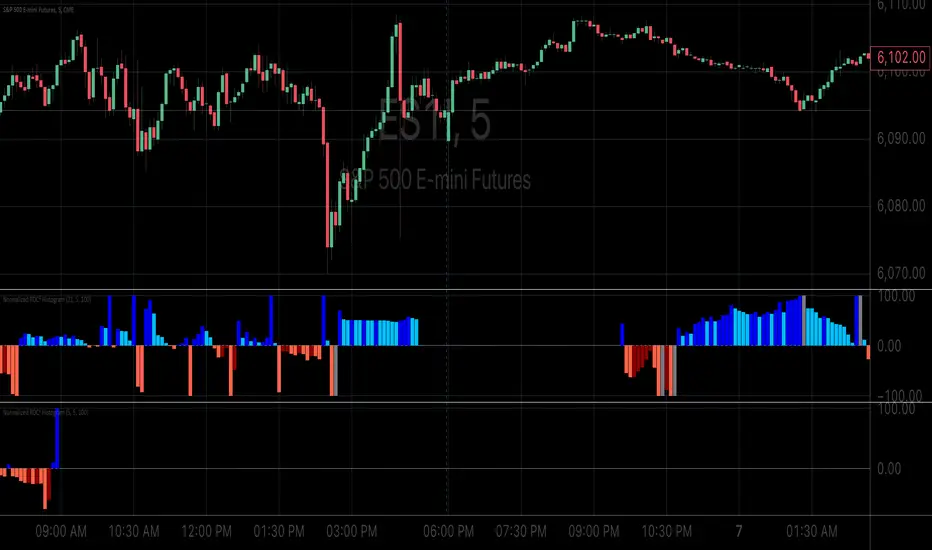
Normalized Rate of Change of Rate of Change (ROC²) Histogram
Overview
The Normalized ROC² Histogram is a momentum-based indicator designed to detect potential trend reversals by measuring the rate of change of the rate of change of price (the second derivative of price movement). This provides insight into when momentum is slowing down, signaling that a price reversal may be approaching.
The indicator also dynamically changes color to highlight shifts in momentum strength, allowing traders to visualize when price acceleration is increasing or decreasing.
How It Works
🔹 Zero Line Crossovers → Potential Direction Change
• When the histogram approaches zero and crosses over, it suggests that price momentum is shifting and a reversal may be imminent.
• Positive to Negative Crossover: Bearish momentum shift.
• Negative to Positive Crossover: Bullish momentum shift.
🔹 Momentum Strength Visualization → Color Shift
• Dark Blue (⬆️ Increasing Positive Momentum) → Price is accelerating upward.
• Light Blue (🔽 Decreasing Positive Momentum) → Uptrend is weakening.
• Dark Red (⬇️ Increasing Negative Momentum) → Price is accelerating downward.
• Light Red (🔼 Decreasing Negative Momentum) → Downtrend is weakening.
🔹 Normalization for Cleaner Visualization
• Prevents extreme volatility spikes from distorting the histogram.
• Normalizes values on a 0 to 100 scale, ensuring consistent bar height.
How to Use It
✅ Watch for Crossovers Near Zero → These can indicate a trend reversal is forming.
✅ Observe Color Changes → A shift from dark to light signals a deceleration, which often precedes price turning points.
✅ Combine with Other Indicators → Works well with Volume Profile, Moving Averages, and Market Structure analysis.
Why This Indicator is Unique
🚀 Second-derivative momentum detection → Provides early insight into potential price shifts.
📊 Normalized bars prevent distortion → No more extreme spikes ruining the scale.
🎯 Color-coded visual cues → Instantly see when momentum is gaining or fading.
📌 Add the Normalized ROC² Histogram to your charts today to detect potential reversals and momentum shifts in real-time! 🚀
オープンソーススクリプト
TradingViewの精神に則り、このスクリプトの作者はコードをオープンソースとして公開してくれました。トレーダーが内容を確認・検証できるようにという配慮です。作者に拍手を送りましょう!無料で利用できますが、コードの再公開はハウスルールに従う必要があります。
I provide expert guidance for crypto traders using Volume Profile and pattern recognition tech
免責事項
この情報および投稿は、TradingViewが提供または推奨する金融、投資、トレード、その他のアドバイスや推奨を意図するものではなく、それらを構成するものでもありません。詳細は利用規約をご覧ください。