OPEN-SOURCE SCRIPT
Regression Slope Shift
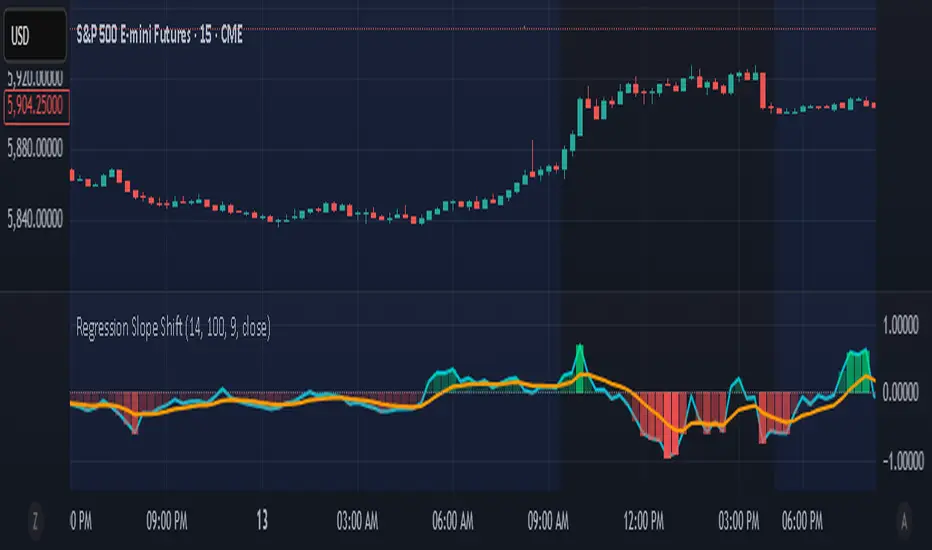
Normalized Regression Slope Shift + Dynamic Histogram
This indicator detects subtle shifts in price momentum using a rolling linear regression approach. It calculates the slope of a linear regression line for each bar over a specified lookback period, then measures how that slope changes from bar to bar.
Both the slope and its change (delta) are normalized to a -1 to 1 scale for consistent visual interpretation across assets and timeframes. A signal line (EMA) is applied to the slope delta to help identify turning points and crossovers.
Key features:
- Normalized slope and slope change lines
- Dynamic histogram of slope delta with transparency based on magnitude
- Customizable colors for all visual elements
- Signal line for crossover-based momentum shifts
This tool helps traders anticipate trend acceleration or weakening before traditional momentum indicators react, making it useful for early trend detection, divergence spotting, and confirmation signals.
オープンソーススクリプト
TradingViewの精神に則り、このスクリプトの作者はコードをオープンソースとして公開してくれました。トレーダーが内容を確認・検証できるようにという配慮です。作者に拍手を送りましょう!無料で利用できますが、コードの再公開はハウスルールに従う必要があります。
免責事項
この情報および投稿は、TradingViewが提供または推奨する金融、投資、トレード、その他のアドバイスや推奨を意図するものではなく、それらを構成するものでもありません。詳細は利用規約をご覧ください。
オープンソーススクリプト
TradingViewの精神に則り、このスクリプトの作者はコードをオープンソースとして公開してくれました。トレーダーが内容を確認・検証できるようにという配慮です。作者に拍手を送りましょう!無料で利用できますが、コードの再公開はハウスルールに従う必要があります。
免責事項
この情報および投稿は、TradingViewが提供または推奨する金融、投資、トレード、その他のアドバイスや推奨を意図するものではなく、それらを構成するものでもありません。詳細は利用規約をご覧ください。