OPEN-SOURCE SCRIPT
DMI + ADX + Key Level NACHOMIXCRYPTO
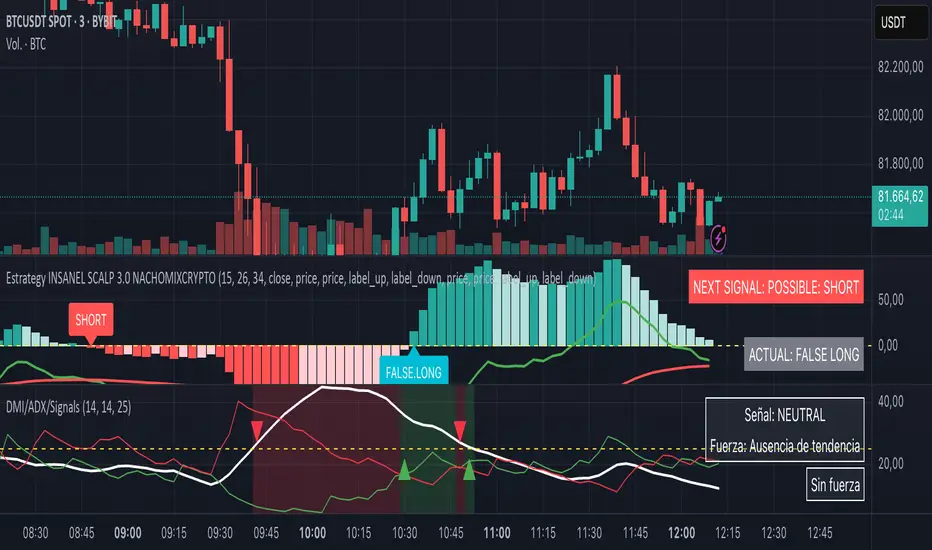
The DMI + ADX + Key Level NACHOMIXCRYPTO indicator is a technical analysis tool that combines the Directional Movement Index (DMI) and the Average Directional Index (ADX) to assess trend strength and direction. It also includes customizable key levels for better visualization.
Components:
ADX (Average Directional Index):
Measures the strength of a trend, regardless of its direction.
Values below 25 indicate a weak trend or range-bound market.
Values between 25-50 suggest a strong trend.
Values between 50-75 indicate a very strong trend.
Values above 75 represent an extremely strong trend.
+DI (Positive Directional Indicator) and -DI (Negative Directional Indicator):
+DI indicates bullish strength, shown in green.
-DI indicates bearish strength, shown in red.
The comparison between these two lines helps determine the market direction.
Features:
Trend Detection:
When +DI is above -DI and ADX is above the key level, it signals a bullish trend.
When -DI is above +DI and ADX is above the key level, it signals a bearish trend.
Key Level Line:
A customizable horizontal line that marks the threshold for trend strength.
Trend Background Color:
Green for strong uptrends and red for strong downtrends.
Signal Arrows:
A green upward triangle is plotted when a new bullish trend starts.
A red downward triangle is plotted when a new bearish trend starts.
Trend Strength Labels:
The indicator displays the current market strength classification and whether the trend is bullish, bearish, or neutral.
Strength Analysis Table:
Provides insights on whether the market has bullish, bearish, mixed strength, or no strength at all.
This indicator is particularly useful for traders looking to identify strong trends and catch early trend reversals.
オープンソーススクリプト
TradingViewの精神に則り、このスクリプトの作者はコードをオープンソースとして公開してくれました。トレーダーが内容を確認・検証できるようにという配慮です。作者に拍手を送りましょう!無料で利用できますが、コードの再公開はハウスルールに従う必要があります。
免責事項
この情報および投稿は、TradingViewが提供または推奨する金融、投資、トレード、その他のアドバイスや推奨を意図するものではなく、それらを構成するものでもありません。詳細は利用規約をご覧ください。
オープンソーススクリプト
TradingViewの精神に則り、このスクリプトの作者はコードをオープンソースとして公開してくれました。トレーダーが内容を確認・検証できるようにという配慮です。作者に拍手を送りましょう!無料で利用できますが、コードの再公開はハウスルールに従う必要があります。
免責事項
この情報および投稿は、TradingViewが提供または推奨する金融、投資、トレード、その他のアドバイスや推奨を意図するものではなく、それらを構成するものでもありません。詳細は利用規約をご覧ください。