OPEN-SOURCE SCRIPT
ViVen - Multi Time Frame - Moving Average Strategy
Hi Traders,
Indicator Description : Multiple Time Frame Moving Average lines in One Chart.
Moving Average Types : SMA, WMA, EMA
Moving Average Period : 20 Default (Variable up to 200)
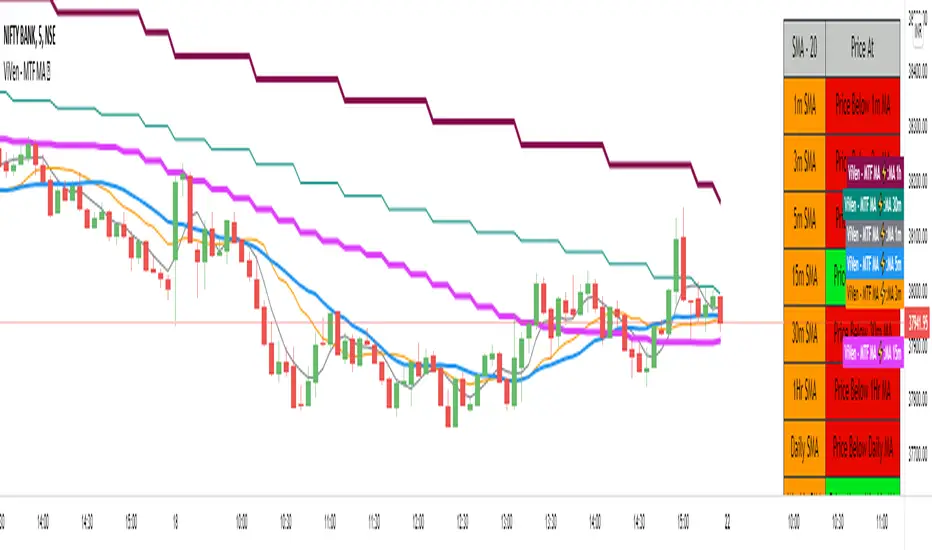
MA Time Frame : 1m, 3m, 5m, 15m, 30m, 1Hr, Daily, Weekly, Monthly (All lines in one chart)
You can turn ON/OFF the moving average lines based on your requirement.
Moving Average Table : The table will give you an idea where the price is currently trading (LTP), if the price is above any of the moving average then it will show you the Price is above MA and wise versa.
Trading Method:
Monthly, Weekly, Daily and 1Hr Moving averages will tell you whether the script is in Bullish Trend or Bearish Trend.
Basically the moving averages will act as Support and Resistance Levels. With candle confirmation you can take trade.
Ready to Take Position - When 1m MA Crosses 3m MA (Upside / Downside)
BUY Strategy:
"Buy" - when 3m MA breaks 5m moving average on the upside. (Intraday/Scalp)
"Hold" - when 5m MA breaks 15m MA on the upside.
"Strong Hold" - when 15m MA breaks 1Hr MA on the upside for Long term.
"Exit" - when 3m MA breaks 5m MA on the Downside.
SELL Strategy:
"Sell" - when 3m MA breaks 5m moving average on the Downside. (Intraday/Scalp)
"Hold" - when 5m MA breaks 15m MA on the Downside. (Intraday)
"Strong Hold" - when 15m MA breaks 1Hr MA on the Downside. (Positional).
"Exit" - when 3m MA breaks 5m MA on the Downside.
If you agree with this strategy and works well please like this script, share it with your friends and Follow me for more Indicators.
In the next Version, I will come up with Strategy table that I have explained here.
Thanks for your support.
Indicator Description : Multiple Time Frame Moving Average lines in One Chart.
Moving Average Types : SMA, WMA, EMA
Moving Average Period : 20 Default (Variable up to 200)
MA Time Frame : 1m, 3m, 5m, 15m, 30m, 1Hr, Daily, Weekly, Monthly (All lines in one chart)
You can turn ON/OFF the moving average lines based on your requirement.
Moving Average Table : The table will give you an idea where the price is currently trading (LTP), if the price is above any of the moving average then it will show you the Price is above MA and wise versa.
Trading Method:
Monthly, Weekly, Daily and 1Hr Moving averages will tell you whether the script is in Bullish Trend or Bearish Trend.
Basically the moving averages will act as Support and Resistance Levels. With candle confirmation you can take trade.
Ready to Take Position - When 1m MA Crosses 3m MA (Upside / Downside)
BUY Strategy:
"Buy" - when 3m MA breaks 5m moving average on the upside. (Intraday/Scalp)
"Hold" - when 5m MA breaks 15m MA on the upside.
"Strong Hold" - when 15m MA breaks 1Hr MA on the upside for Long term.
"Exit" - when 3m MA breaks 5m MA on the Downside.
SELL Strategy:
"Sell" - when 3m MA breaks 5m moving average on the Downside. (Intraday/Scalp)
"Hold" - when 5m MA breaks 15m MA on the Downside. (Intraday)
"Strong Hold" - when 15m MA breaks 1Hr MA on the Downside. (Positional).
"Exit" - when 3m MA breaks 5m MA on the Downside.
If you agree with this strategy and works well please like this script, share it with your friends and Follow me for more Indicators.
In the next Version, I will come up with Strategy table that I have explained here.
Thanks for your support.
オープンソーススクリプト
TradingViewの精神に則り、このスクリプトの作者はコードをオープンソースとして公開してくれました。トレーダーが内容を確認・検証できるようにという配慮です。作者に拍手を送りましょう!無料で利用できますが、コードの再公開はハウスルールに従う必要があります。
免責事項
この情報および投稿は、TradingViewが提供または推奨する金融、投資、トレード、その他のアドバイスや推奨を意図するものではなく、それらを構成するものでもありません。詳細は利用規約をご覧ください。
オープンソーススクリプト
TradingViewの精神に則り、このスクリプトの作者はコードをオープンソースとして公開してくれました。トレーダーが内容を確認・検証できるようにという配慮です。作者に拍手を送りましょう!無料で利用できますが、コードの再公開はハウスルールに従う必要があります。
免責事項
この情報および投稿は、TradingViewが提供または推奨する金融、投資、トレード、その他のアドバイスや推奨を意図するものではなく、それらを構成するものでもありません。詳細は利用規約をご覧ください。