OPEN-SOURCE SCRIPT
Earnings Beat Indicator
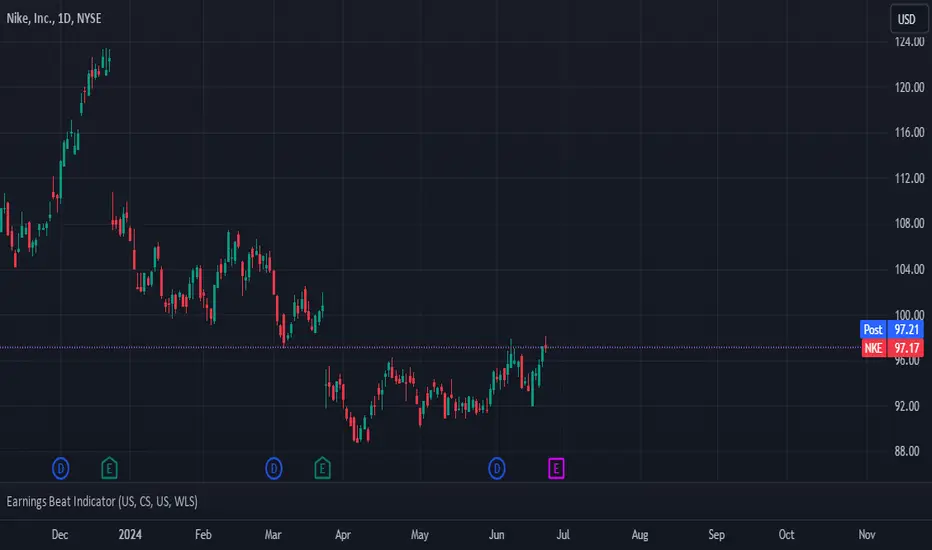
This indicator seeks to predict whether a stock will beat or miss earnings by forecasting revenues, and subsequently net income, using linear regression. The y-values of this regression are revenues and the x-axis is an economic series of your choosing. Double-click the status line (the words "US" and "GDP") to change economic datasets. The full list of economic datasets available in TradingView is in the Help Center.
Instructions:
1. Double-click on the status line (the fields "US" and "GDP"). The inputs tab will pop up.
2. Type in the country and data codes for the economic datasets you believe have the highest correlation with revenues and net margins respectively.
3. Check the correlation coefficient between financial data and economic data by interpreting the white and gray numbers on the status line - white for the correlation coefficient between revenues and your chosen economic dataset, and gray for the correlation coefficient between net margins and your chosen economic dataset. These numbers should be as close to +1 or -1 as possible.
4. Interpret the results - the blue number indicates whether revenues will beat estimates and the green number indicates whether earnings will beat estimates. A 1 for both outputs indicates a double beat, a 1 and a 0 indicates a revenue beat but not an earnings beat, a 0 and a 1 indicates an earnings beat but not a revenue beat, and a 0 and a 0 indicates a double miss.
- DickZhones
オープンソーススクリプト
TradingViewの精神に則り、このスクリプトの作者はコードをオープンソースとして公開してくれました。トレーダーが内容を確認・検証できるようにという配慮です。作者に拍手を送りましょう!無料で利用できますが、コードの再公開はハウスルールに従う必要があります。
免責事項
この情報および投稿は、TradingViewが提供または推奨する金融、投資、トレード、その他のアドバイスや推奨を意図するものではなく、それらを構成するものでもありません。詳細は利用規約をご覧ください。
オープンソーススクリプト
TradingViewの精神に則り、このスクリプトの作者はコードをオープンソースとして公開してくれました。トレーダーが内容を確認・検証できるようにという配慮です。作者に拍手を送りましょう!無料で利用できますが、コードの再公開はハウスルールに従う必要があります。
免責事項
この情報および投稿は、TradingViewが提供または推奨する金融、投資、トレード、その他のアドバイスや推奨を意図するものではなく、それらを構成するものでもありません。詳細は利用規約をご覧ください。