OPEN-SOURCE SCRIPT
更新済 TTM FCFF Yield %
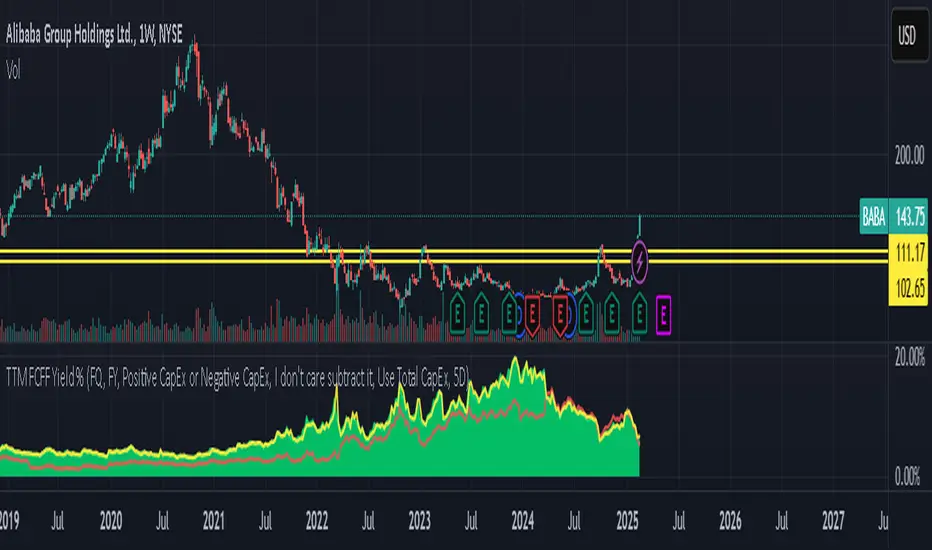
An indicator that shows the Free Cash Flow yield daily for the underlying ticker. Useful for when you need to screen for ideas, or the news just broke out and you want to make a calculated purchase - rather than buying at whatever price it is at the moment.
Green line tracks daily Free Cash Flow yield to Enterprise Value.
Where Free Cash Flow is defined as = Cashflow from Operations + Depreciation and Amortization (from the income statement) - Capital Expenditure (fixed assets) - Change in Working Capital
And where Enterprise Value is defined as = Market Capitalization + Net Debt
Red line tracks Free Cash Flow of financial year and what FCFF yield does that equate to if the stock current trades at the price right now.
Reminder: When working with international equities. Be mindful of whether they report FQ or FH. For example, France only reports FH, so it's better to use TTM FHFree Cash Flow results. If you didn't toggle FH in the indicator settings, it will automatically set as FQ and it will not show anything.
GLHF
リリースノート
Added new feature to calculate FCFF Yield % using historical prices in case there is market noise. As negative FCFF Yield % looks like it is treading back into positive territory, but in reality it is just because EV is calculated using Market Capitalization which drags it upwards.リリースノート
Patched!リリースノート
Patch 2.リリースノート
Patch 3 lolリリースノート
Last patch I promise lolオープンソーススクリプト
TradingViewの精神に則り、このスクリプトの作者はコードをオープンソースとして公開してくれました。トレーダーが内容を確認・検証できるようにという配慮です。作者に拍手を送りましょう!無料で利用できますが、コードの再公開はハウスルールに従う必要があります。
免責事項
この情報および投稿は、TradingViewが提供または推奨する金融、投資、トレード、その他のアドバイスや推奨を意図するものではなく、それらを構成するものでもありません。詳細は利用規約をご覧ください。
オープンソーススクリプト
TradingViewの精神に則り、このスクリプトの作者はコードをオープンソースとして公開してくれました。トレーダーが内容を確認・検証できるようにという配慮です。作者に拍手を送りましょう!無料で利用できますが、コードの再公開はハウスルールに従う必要があります。
免責事項
この情報および投稿は、TradingViewが提供または推奨する金融、投資、トレード、その他のアドバイスや推奨を意図するものではなく、それらを構成するものでもありません。詳細は利用規約をご覧ください。