OPEN-SOURCE SCRIPT
更新済 Bitfinex BTC longs/total ratio

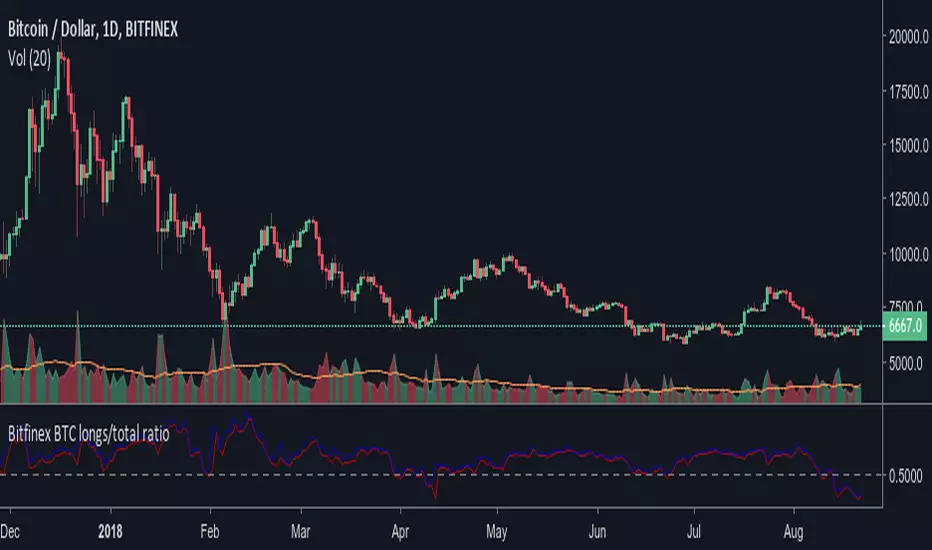
Ratio of bitfinex longs versus the total btc in positions. Maybe a good indicator of market sentiment. It allows you to see too where were people taking profit or closing positions. Remember that ratio going up doesn't necesarily mean more longs positions are being added. It could mean shorts are closing position massively. The conversely is also true.
The rate above 0.5 doesn't necesarily bullish, though, and the indicator is "timeframe" agnostic. So take into account that there could be tons of longs positions that were opened since back before summer 2017, It seems to be too of positions opened at prices below 4.000$. That's why the average seems to be around 0.6.
The blue lines indicates current ratio (or on close for past bars). The red line is the max ratio (higher shorts versus lowest longs).
リリースノート
Now, it adds the BTCEUR and BTCJPY pairs to the calculation, in case the metric changes in some point in the future, but so far it is irrelevant since the 98% of positions are in the BTCUSD market.リリースノート
- Removed EUR/JPY positions. Amounts too tiny in comparision with BTCUSD and the load time of the scripts increases significantly.- Now you can see the change ratio of longs (green), shorts (red) and shorts+longs (gray) per candle. For example, a value of -0.1 for shorts means the shorts has drop a 10% respect to the previous bar/candle.
- The longs/total ratio (blue) now applies a -0.5, to center the line with respect to the other lines, so they are more comfortable to see. A value of 0.1 means the longs/total ratio is 0.5+0.1, or 60% of total.
オープンソーススクリプト
TradingViewの精神に則り、このスクリプトの作者はコードをオープンソースとして公開してくれました。トレーダーが内容を確認・検証できるようにという配慮です。作者に拍手を送りましょう!無料で利用できますが、コードの再公開はハウスルールに従う必要があります。
免責事項
この情報および投稿は、TradingViewが提供または推奨する金融、投資、トレード、その他のアドバイスや推奨を意図するものではなく、それらを構成するものでもありません。詳細は利用規約をご覧ください。
オープンソーススクリプト
TradingViewの精神に則り、このスクリプトの作者はコードをオープンソースとして公開してくれました。トレーダーが内容を確認・検証できるようにという配慮です。作者に拍手を送りましょう!無料で利用できますが、コードの再公開はハウスルールに従う必要があります。
免責事項
この情報および投稿は、TradingViewが提供または推奨する金融、投資、トレード、その他のアドバイスや推奨を意図するものではなく、それらを構成するものでもありません。詳細は利用規約をご覧ください。