INVITE-ONLY SCRIPT
Impulse+
アップデート済

This indicator is a trade setup inspired by the Impulse Trading System published by Alexander Elder.
This setup should only be used for long trades and not short trades.
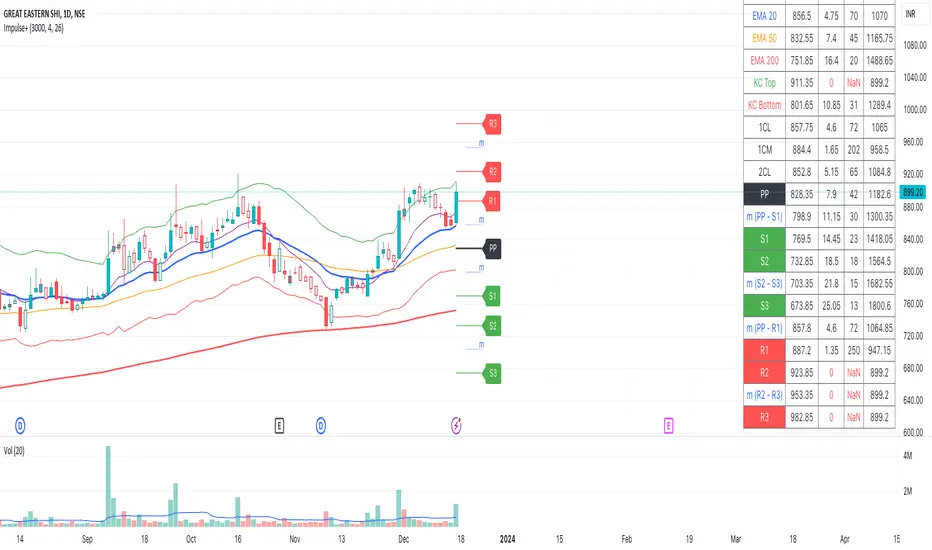
This setup includes trend analysis using 4 EMA lines, volatility range using Keltner Channels, momentum on each bar using MACD and 10 EMA and also helps managing risk on each trade by calculating the max quantity for the max risk specified in the settings. Each of the above is described in detail below:
Trend Analysis
This indicator displays 4 EMA lines (10, 20, 50 and 200). These lines can serve as an indicator to gauge the trend of the stock.
Volatility Analysis
This setup also includes Keltner Channels using ATR 14 and 20 EMA with a multiplier of 2. Widening channel indicates an increase in volatility and vice versa.
Momentum Analysis
Momentum is calculated on each bar and are according color coded. The bar can have 3 possible colors. Aqua / Green indicates a bullish momentum. Gray indicates sideways momentum and Red indicates a bearish momentum.
The momentum is derived by using MACD and EMA 10.
If the EMA 10, MACD and MACD Histogram have a positive slope, the bar is colored green indicating a bullish momentum. While if all the 3 have a negative slope, the bar is colored red indicating a bearish momentum. However if there is a mismatch in the slope of the 3 entities, the bars are colored gray indicating sideways movement.
Risk Management
This indicator takes max risk per trade as one of the settings parameters. Based on this, the indicator calculates the maximum quantity to be purchased for different stop loss values. Also as a utility, the indicator also displays target on a 1:3 risk reward ratio.
A table is displayed at the bottom right of the chart which displays the possible stop loss and their corresponding quantity.
The stop losses considered are EMA 10, EMA 20, EMA 50, EMA 200, Keltner Channel Top, Keltner Channel Bottom, 1 Candle Low, 1 Candle Mid and 2 Candle Low.
These stop losses are only indicative and should be followed as per risk appetite of the consumer.
The trade setup is primarily built for daily timeframe, however the same logic can be applied to other time frames as well. The indicator follows the chart timeframe.
リリースノート
v2 Upgrade- Added Monthly Pivot Points to the chart.
- Added Target Factor in Inputs
- Added Pivot Points to the Risk Table
リリースノート
Auto switch of the pivot timeframe based on IntraDay and Daily Candlesリリースノート
Updated code to request higher timeframe data.招待専用スクリプト
このスクリプトへのアクセスは作者が許可したユーザーに制限されており、通常はお支払いが必要です。お気に入りに追加することはできますが、許可を申請して作者が許可した後でなければ使用することはできません。 詳細については alvarajath にお問い合わせいただくか、以下の作者の指示に従ってください。
スクリプトの動作を理解していて作者も100%信頼できるということでなければ、TradingViewとしてはお金を払ってまでスクリプトを利用するのはお勧めしません。そのかわりに、コミュニティスクリプトでオープンソースの優れたスクリプトが無料で見つけられることが多々あります。
作者の指示
″Message me on TradingView to get access to the indicator.
チャートでこのスクリプトを利用したいですか?
注: アクセス権をリクエストされる前にこちらをご覧ください。
免責事項
これらの情報および投稿は、TradingViewが提供または保証する金融、投資、取引、またはその他の種類のアドバイスや推奨を意図したものではなく、またそのようなものでもありません。詳しくは利用規約をご覧ください。