OPEN-SOURCE SCRIPT
更新済 Bear Bull Ratio (BBR)
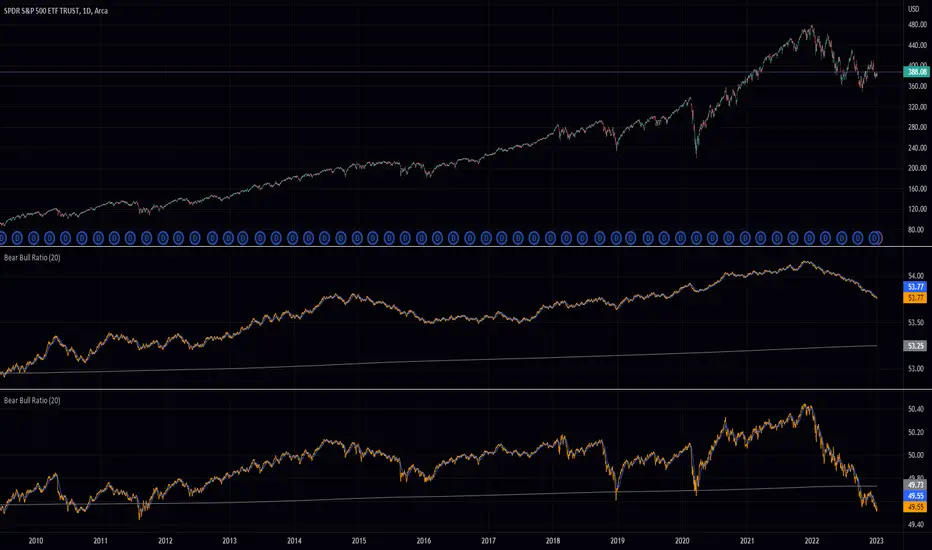
This indicator calculates the ratio of bearish to bullish candles over a certain window of time. It does this by keeping track of the number or distance (depending on the "Enable True Range Mode" input) between the high and low prices of bullish and bearish candles, respectively, and then dividing the total distance of bullish candles by the sum of the distances of both bullish and bearish candles. The resulting ratio is then plotted on the chart as a percentage. The indicator also plots a smoothed version of the ratio using a weighted moving average and the average of the ratio over the entire length of the chart, for both the "True Range Mode" and "Normal Mode".
リリースノート
typo fixオープンソーススクリプト
TradingViewの精神に則り、このスクリプトの作者はコードをオープンソースとして公開してくれました。トレーダーが内容を確認・検証できるようにという配慮です。作者に拍手を送りましょう!無料で利用できますが、コードの再公開はハウスルールに従う必要があります。
免責事項
この情報および投稿は、TradingViewが提供または推奨する金融、投資、トレード、その他のアドバイスや推奨を意図するものではなく、それらを構成するものでもありません。詳細は利用規約をご覧ください。
オープンソーススクリプト
TradingViewの精神に則り、このスクリプトの作者はコードをオープンソースとして公開してくれました。トレーダーが内容を確認・検証できるようにという配慮です。作者に拍手を送りましょう!無料で利用できますが、コードの再公開はハウスルールに従う必要があります。
免責事項
この情報および投稿は、TradingViewが提供または推奨する金融、投資、トレード、その他のアドバイスや推奨を意図するものではなく、それらを構成するものでもありません。詳細は利用規約をご覧ください。