OPEN-SOURCE SCRIPT
更新済 even_better_sinewave_mod

Description:
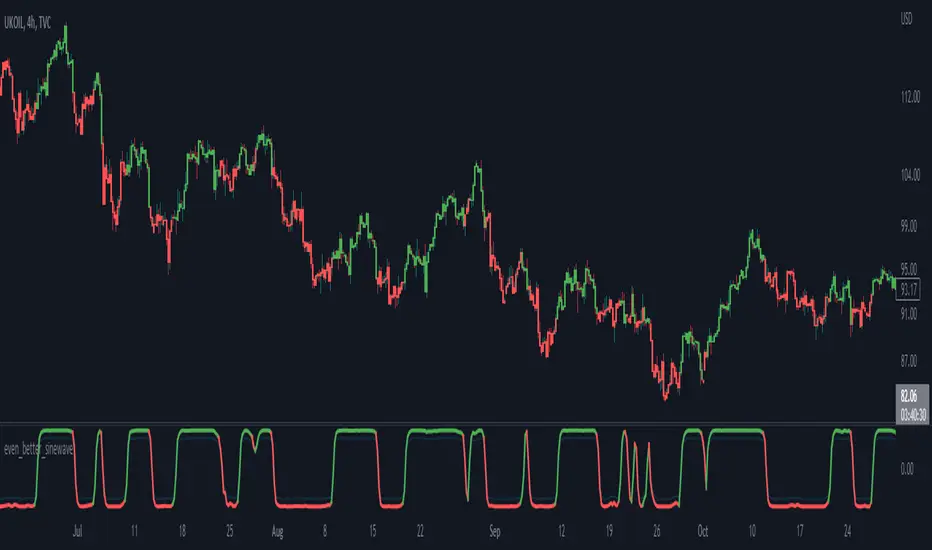
Even better sinewave was an indicator developed by John F. Ehlers (see Cycle Analytics for Trader, pg. 159), in which improvement to cycle measurements completely relies on strong normalization of the waveform. The indicator aims to create an artificially predictive indicator by transferring the cyclic data swings into a sine wave. In this indicator, the modified is on the weighted moving average as a smoothing function, instead of using the super smoother, aim to be more adaptive, and the default length is set to 55 bars.
Sinewave
smoothing = (7*hp + 6*hp_1 + 5*hp_2+ 4*hp_3 + 3*hp_4 + 2*hp5 + hp_6) /28
normalize = wave/sqrt(power)
Notes:
- sinewave indicator crossing over -0.9 is considered to beginning of the cycle while crossing under 0.9 is considered as an end of the cycle
- line color turns to green considered as a confirmation of an uptrend, while turns red as a confirmation of a downtrend
- confidence of using indicator will be much in confirmation paired with another indicator such dynamic trendline e.g. moving average
- as cited within Ehlers book Cycle Analytic for Traders, the indicator will be useful if the satisfied market cycle mode and the period of the dominant cycle must be estimated with reasonable accuracy
Other Example
リリースノート
adjusting the high-pass filter, and re-arrange the color conditionリリースノート
update plot, adding create an alert and barcolor optionsオープンソーススクリプト
TradingViewの精神に則り、このスクリプトの作者はコードをオープンソースとして公開してくれました。トレーダーが内容を確認・検証できるようにという配慮です。作者に拍手を送りましょう!無料で利用できますが、コードの再公開はハウスルールに従う必要があります。
免責事項
この情報および投稿は、TradingViewが提供または推奨する金融、投資、トレード、その他のアドバイスや推奨を意図するものではなく、それらを構成するものでもありません。詳細は利用規約をご覧ください。
オープンソーススクリプト
TradingViewの精神に則り、このスクリプトの作者はコードをオープンソースとして公開してくれました。トレーダーが内容を確認・検証できるようにという配慮です。作者に拍手を送りましょう!無料で利用できますが、コードの再公開はハウスルールに従う必要があります。
免責事項
この情報および投稿は、TradingViewが提供または推奨する金融、投資、トレード、その他のアドバイスや推奨を意図するものではなく、それらを構成するものでもありません。詳細は利用規約をご覧ください。