OPEN-SOURCE SCRIPT
更新済 ChangeTrend [kingthies_]
% X Change Over Y Amount of Time
AKA "ChangeTrend"
Published by user Eric Thies [kingthies_] on 9/3/2020
Description
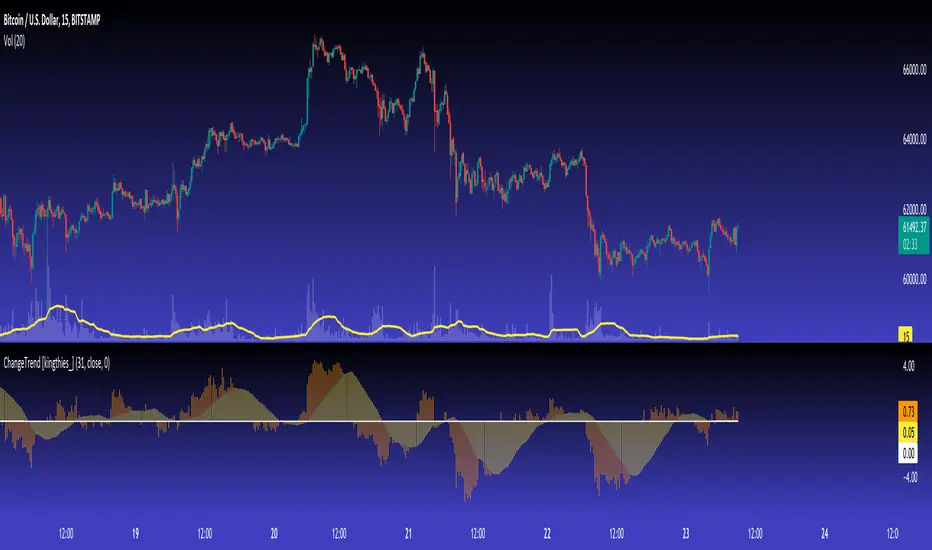
Relatively simple script that is measuring the performance of the input over the previous y # bars.
The EMA appears to make troughs and peaks easy to see coming / look at as they happen.
Interpretation:
Cheers,
AKA "ChangeTrend"
Published by user Eric Thies [kingthies_] on 9/3/2020
Description
Relatively simple script that is measuring the performance of the input over the previous y # bars.
The EMA appears to make troughs and peaks easy to see coming / look at as they happen.
Interpretation:
- Orange Histogram Represents the immediate % Change
- Yellow Histogram represents the overall trend of such as an SMA of the same Y # of bars.
Cheers,
リリースノート
Upgraded to pine v5オープンソーススクリプト
TradingViewの精神に則り、このスクリプトの作者はコードをオープンソースとして公開してくれました。トレーダーが内容を確認・検証できるようにという配慮です。作者に拍手を送りましょう!無料で利用できますが、コードの再公開はハウスルールに従う必要があります。
Eric Thies
免責事項
この情報および投稿は、TradingViewが提供または推奨する金融、投資、トレード、その他のアドバイスや推奨を意図するものではなく、それらを構成するものでもありません。詳細は利用規約をご覧ください。
オープンソーススクリプト
TradingViewの精神に則り、このスクリプトの作者はコードをオープンソースとして公開してくれました。トレーダーが内容を確認・検証できるようにという配慮です。作者に拍手を送りましょう!無料で利用できますが、コードの再公開はハウスルールに従う必要があります。
Eric Thies
免責事項
この情報および投稿は、TradingViewが提供または推奨する金融、投資、トレード、その他のアドバイスや推奨を意図するものではなく、それらを構成するものでもありません。詳細は利用規約をご覧ください。