OPEN-SOURCE SCRIPT
BTCUSD vs S&P500 (Daily)
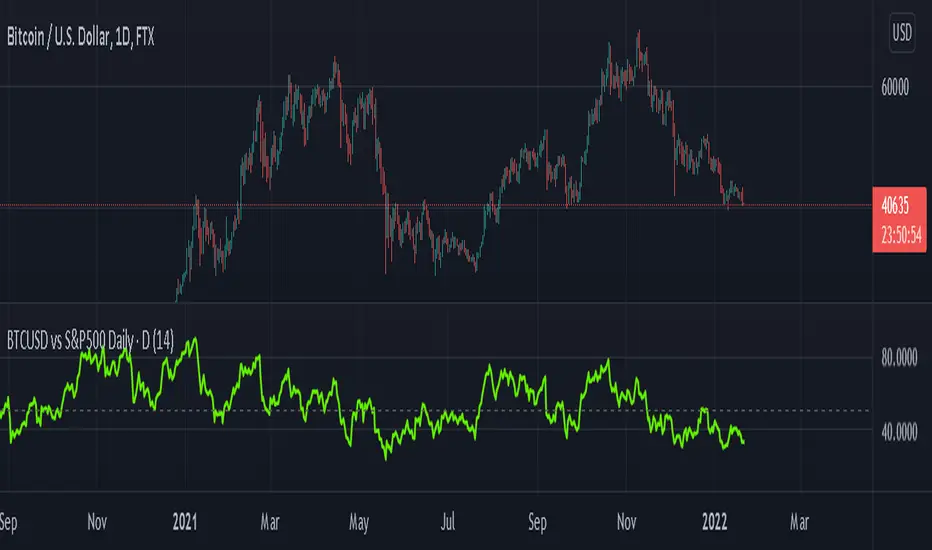
This script plots an RSI of the difference between the BTCUSD (FTX) and S&P 500 (FRED) prices, useful to see how the BTCUSD price correlates to the stock market.
This works in the daily timeframe only (because the S&P 500 can only be sampled on this timeframe). You can try lower timeframes but they will be gapped / interpolated.
This works in the daily timeframe only (because the S&P 500 can only be sampled on this timeframe). You can try lower timeframes but they will be gapped / interpolated.
オープンソーススクリプト
TradingViewの精神に則り、このスクリプトの作者はコードをオープンソースとして公開してくれました。トレーダーが内容を確認・検証できるようにという配慮です。作者に拍手を送りましょう!無料で利用できますが、コードの再公開はハウスルールに従う必要があります。
免責事項
この情報および投稿は、TradingViewが提供または推奨する金融、投資、トレード、その他のアドバイスや推奨を意図するものではなく、それらを構成するものでもありません。詳細は利用規約をご覧ください。
オープンソーススクリプト
TradingViewの精神に則り、このスクリプトの作者はコードをオープンソースとして公開してくれました。トレーダーが内容を確認・検証できるようにという配慮です。作者に拍手を送りましょう!無料で利用できますが、コードの再公開はハウスルールに従う必要があります。
免責事項
この情報および投稿は、TradingViewが提供または推奨する金融、投資、トレード、その他のアドバイスや推奨を意図するものではなく、それらを構成するものでもありません。詳細は利用規約をご覧ください。