OPEN-SOURCE SCRIPT
AntoQQE - Histogram
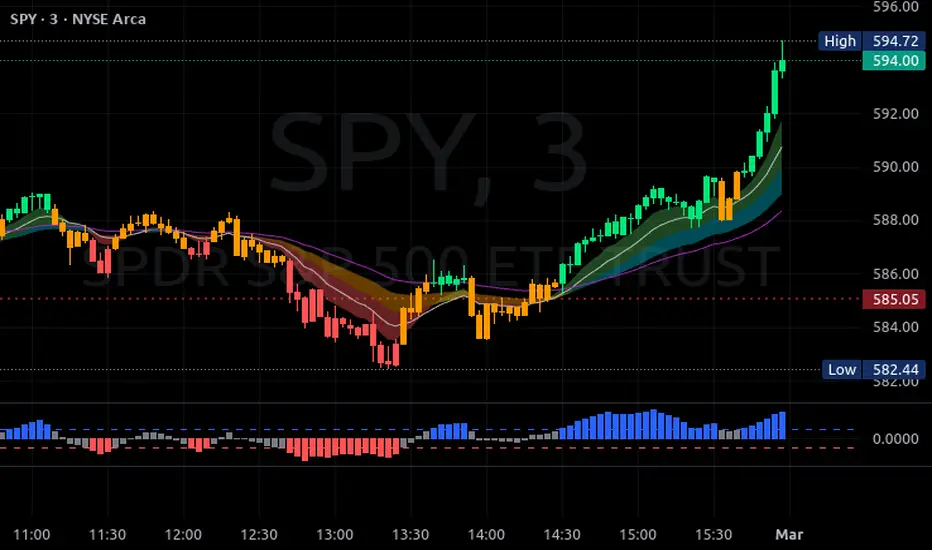
This script displays a QQE-based momentum histogram, derived from the RSI line’s deviation around a neutral 50 level. It uses a smoothed RSI, monitors volatility with a dynamically adjusted multiplier, and then plots a color-coded histogram that helps traders see when the RSI is entering strong bullish or bearish territory:
• Smoothed RSI Calculation
The script calculates RSI for a user-defined period and then smooths it with an EMA. This reduces noise in the indicator’s readings.
• Dynamic Average Range (DAR)
The script computes volatility by taking the absolute change of the smoothed RSI, applying two EMAs, and multiplying by a QQE factor. This produces a band around the RSI that adapts to changes in market volatility.
• Histogram Centering and Thresholds
Rather than plotting the RSI itself, the script subtracts 50 from the RSI to center it around zero. Columns are plotted for each bar:
Blue when momentum is significantly above zero (over a threshold value).
Red when momentum is significantly below zero (under a negative threshold).
Gray when momentum is within a neutral range.
• Usage
By observing when columns turn blue or red—and how far they extend above or below zero—traders can quickly gauge the market’s momentum. The horizontal threshold lines (dashed by default) provide clear breakout levels for bullish or bearish conditions, which can help confirm entries or exits based on shifting market sentiment. It is best paired with the AntoQQE - Bars indicator for better chart visualization.
オープンソーススクリプト
TradingViewの精神に則り、このスクリプトの作者はコードをオープンソースとして公開してくれました。トレーダーが内容を確認・検証できるようにという配慮です。作者に拍手を送りましょう!無料で利用できますが、コードの再公開はハウスルールに従う必要があります。
免責事項
この情報および投稿は、TradingViewが提供または推奨する金融、投資、トレード、その他のアドバイスや推奨を意図するものではなく、それらを構成するものでもありません。詳細は利用規約をご覧ください。
オープンソーススクリプト
TradingViewの精神に則り、このスクリプトの作者はコードをオープンソースとして公開してくれました。トレーダーが内容を確認・検証できるようにという配慮です。作者に拍手を送りましょう!無料で利用できますが、コードの再公開はハウスルールに従う必要があります。
免責事項
この情報および投稿は、TradingViewが提供または推奨する金融、投資、トレード、その他のアドバイスや推奨を意図するものではなく、それらを構成するものでもありません。詳細は利用規約をご覧ください。