OPEN-SOURCE SCRIPT
25-Day Momentum Index
Description:
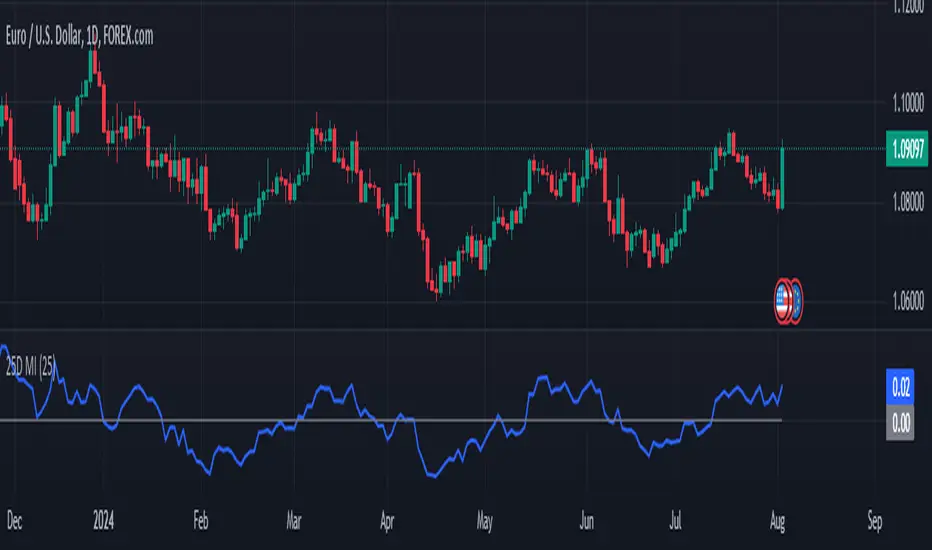
The 25-Day Momentum Index (25D MI) is a technical indicator designed to measure the strength and direction of price movements over a 25-day period. Inspired by classic momentum analysis, this indicator helps traders identify trends and potential reversal points in the market.
How It Works:
Momentum Calculation: The 25D MI calculates momentum as the difference between the current closing price and the closing price 25 days ago. This difference provides insights into the market's recent strength or weakness.
Plotting: The indicator plots the Momentum Index as a blue line, showing the raw momentum values. A zero line is also plotted in gray to serve as a reference point for positive and negative momentum.
Highlighting Zones:
Positive Momentum: When the Momentum Index is above zero, it is plotted in green, highlighting positive momentum phases.
Negative Momentum: When the Momentum Index is below zero, it is plotted in red, highlighting negative momentum phases.
Usage:
A rising curve means an increase in upward momentum - if it is above the zero line. A rising curve below the zero line signifies a decrease in downward momentum. By the same token, a falling curve means an increase in downward momentum below the zero line, a decrease in upward momentum above the zero line.
This indicator is ideal for traders looking to complement their strategy with a visual tool that captures the essence of market momentum over a significant period. Use it to enhance your technical analysis and refine your trading decisions.
オープンソーススクリプト
TradingViewの精神に則り、このスクリプトの作者はコードをオープンソースとして公開してくれました。トレーダーが内容を確認・検証できるようにという配慮です。作者に拍手を送りましょう!無料で利用できますが、コードの再公開はハウスルールに従う必要があります。
免責事項
この情報および投稿は、TradingViewが提供または推奨する金融、投資、トレード、その他のアドバイスや推奨を意図するものではなく、それらを構成するものでもありません。詳細は利用規約をご覧ください。
オープンソーススクリプト
TradingViewの精神に則り、このスクリプトの作者はコードをオープンソースとして公開してくれました。トレーダーが内容を確認・検証できるようにという配慮です。作者に拍手を送りましょう!無料で利用できますが、コードの再公開はハウスルールに従う必要があります。
免責事項
この情報および投稿は、TradingViewが提供または推奨する金融、投資、トレード、その他のアドバイスや推奨を意図するものではなく、それらを構成するものでもありません。詳細は利用規約をご覧ください。