OPEN-SOURCE SCRIPT
BTCBOT2
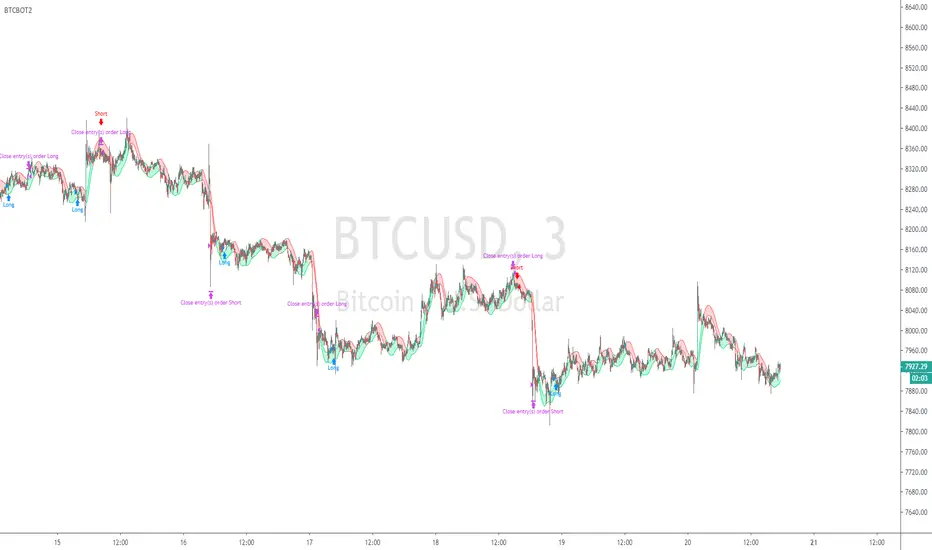
Watches 3 Symbols with separate timeframe control, with Hull Moving Average crossovers on each,  DXY
DXY  XAU/USD
  BTC/USD
and a daily candle crossover. With StopLoss and Target Price and Backtesting history selection control. Entry and Exit rules visible in script (script open)
So if DXY chart is going down and Gold chart going up and Bitcoin chart going up then it will enter a buy, yes it is watching more than just bitcoin itself.
it needs HMA to match on all 3 charts and with selected timeframes, the timeframe of users chart, the timeframe in settings for the HMA's on the symbols. Also a Daily Candle chart of the users selected chart (symbol)
オープンソーススクリプト
TradingViewの精神に則り、このスクリプトの作者はコードをオープンソースとして公開してくれました。トレーダーが内容を確認・検証できるようにという配慮です。作者に拍手を送りましょう!無料で利用できますが、コードの再公開はハウスルールに従う必要があります。
免責事項
この情報および投稿は、TradingViewが提供または推奨する金融、投資、トレード、その他のアドバイスや推奨を意図するものではなく、それらを構成するものでもありません。詳細は利用規約をご覧ください。
オープンソーススクリプト
TradingViewの精神に則り、このスクリプトの作者はコードをオープンソースとして公開してくれました。トレーダーが内容を確認・検証できるようにという配慮です。作者に拍手を送りましょう!無料で利用できますが、コードの再公開はハウスルールに従う必要があります。
免責事項
この情報および投稿は、TradingViewが提供または推奨する金融、投資、トレード、その他のアドバイスや推奨を意図するものではなく、それらを構成するものでもありません。詳細は利用規約をご覧ください。