OPEN-SOURCE SCRIPT
MOKI V1
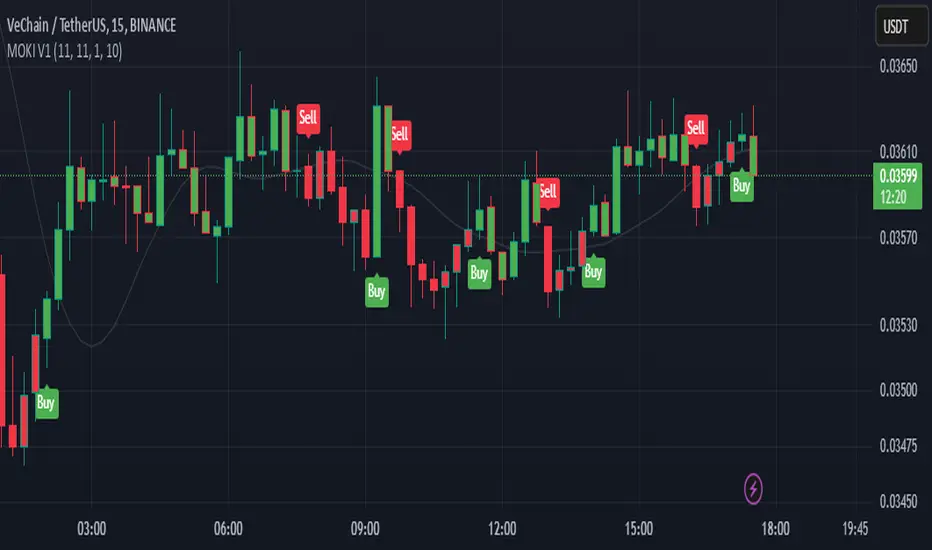
The "MOKI V1" script is a trading strategy on the TradingView platform that uses a combination of two key indicators to identify buy and sell signals:
EMA200 (Exponential Moving Average 200): Used to determine the overall market trend. This line helps ensure that trades are made in the direction of the primary market trend.
RSI (Relative Strength Index): Used to measure the strength or weakness of a trend. In this strategy, a reading above 50 for the RSI indicates stronger buy signals.
Engulfing Pattern: This candlestick pattern occurs when a green (bullish) candle completely engulfs the previous red (bearish) candle. It is used as a buy signal when combined with the other indicators.
オープンソーススクリプト
TradingViewの精神に則り、このスクリプトの作者はコードをオープンソースとして公開してくれました。トレーダーが内容を確認・検証できるようにという配慮です。作者に拍手を送りましょう!無料で利用できますが、コードの再公開はハウスルールに従う必要があります。
免責事項
この情報および投稿は、TradingViewが提供または推奨する金融、投資、トレード、その他のアドバイスや推奨を意図するものではなく、それらを構成するものでもありません。詳細は利用規約をご覧ください。
オープンソーススクリプト
TradingViewの精神に則り、このスクリプトの作者はコードをオープンソースとして公開してくれました。トレーダーが内容を確認・検証できるようにという配慮です。作者に拍手を送りましょう!無料で利用できますが、コードの再公開はハウスルールに従う必要があります。
免責事項
この情報および投稿は、TradingViewが提供または推奨する金融、投資、トレード、その他のアドバイスや推奨を意図するものではなく、それらを構成するものでもありません。詳細は利用規約をご覧ください。