OPEN-SOURCE SCRIPT
Coefficient of Variation [DW]
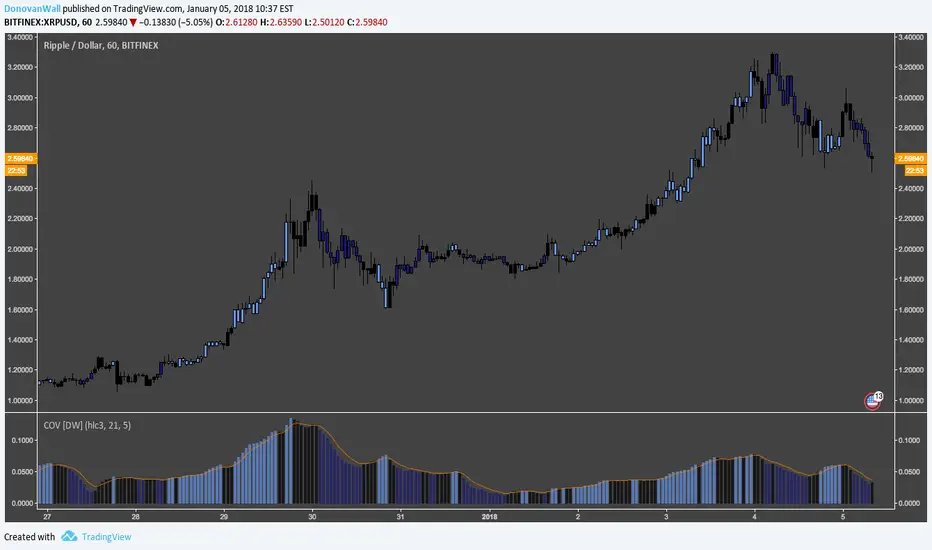
This is a simple gauge of volatility using the Coefficient of Variation.
COV is calculated by dividing standard deviation of price by the expected (average) price.
Custom color scheme indicates increases and decreases in volatility, which is indicated when the COV forms new half period highs and lows.
COV is calculated by dividing standard deviation of price by the expected (average) price.
Custom color scheme indicates increases and decreases in volatility, which is indicated when the COV forms new half period highs and lows.
オープンソーススクリプト
TradingViewの精神に則り、このスクリプトの作者はコードをオープンソースとして公開してくれました。トレーダーが内容を確認・検証できるようにという配慮です。作者に拍手を送りましょう!無料で利用できますが、コードの再公開はハウスルールに従う必要があります。
For my full list of premium tools, check the blog:
wallanalytics.com/
Reach out on Telegram:
t.me/DonovanWall
wallanalytics.com/
Reach out on Telegram:
t.me/DonovanWall
免責事項
この情報および投稿は、TradingViewが提供または推奨する金融、投資、トレード、その他のアドバイスや推奨を意図するものではなく、それらを構成するものでもありません。詳細は利用規約をご覧ください。