OPEN-SOURCE SCRIPT
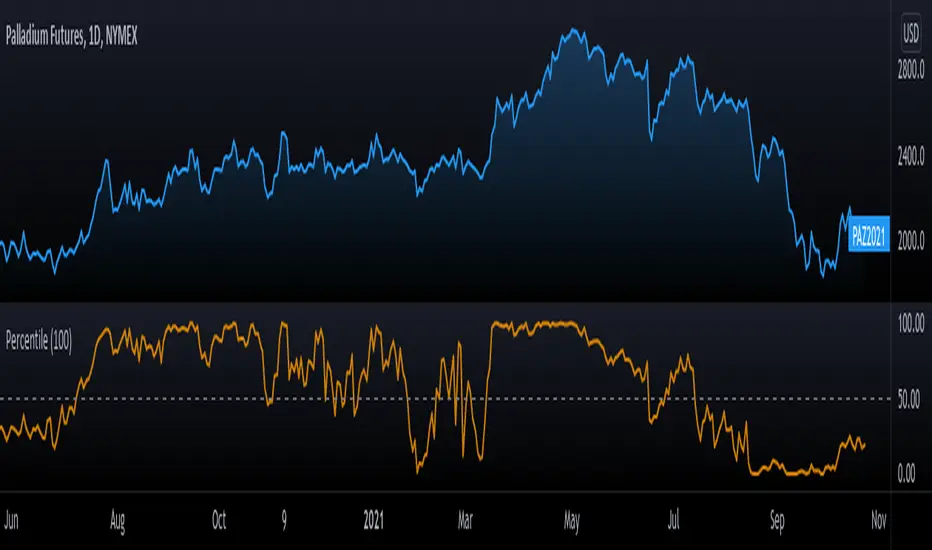
Percentile Rank [racer8]

The Percentile is a mathematical tool developed in the field of statistics. It determines how a value compares to a set of values.
There are many applications for this like ...
... determining your rank in your college math class
... your rank in terms of height, weight, economic status, etc.
... determining the 3-month percentile of the current stock price (which is what this indicator performs)
This indicator calculates the percentile rank for the current stock price for n periods.
For example, if the stock's current price is above 80% of the previous stock's prices over a 100-period span, then it has a percentile rank of 80.
For traders, this is extremely valuable information because it tells you if the current stock price is overbought or oversold.
If the stock's price is in the 95th percentile, then it is highly likely that it is OVERBOUGHT, and that it will revert back to the mean price.
Helplful TIP: I recommend that you set the indicator to look back over at LEAST 100 periods for accuracy!
Thanks for reading! 👍
オープンソーススクリプト
TradingViewの精神に則り、このスクリプトの作者はコードをオープンソースとして公開してくれました。トレーダーが内容を確認・検証できるようにという配慮です。作者に拍手を送りましょう!無料で利用できますが、コードの再公開はハウスルールに従う必要があります。
免責事項
この情報および投稿は、TradingViewが提供または推奨する金融、投資、トレード、その他のアドバイスや推奨を意図するものではなく、それらを構成するものでもありません。詳細は利用規約をご覧ください。
オープンソーススクリプト
TradingViewの精神に則り、このスクリプトの作者はコードをオープンソースとして公開してくれました。トレーダーが内容を確認・検証できるようにという配慮です。作者に拍手を送りましょう!無料で利用できますが、コードの再公開はハウスルールに従う必要があります。
免責事項
この情報および投稿は、TradingViewが提供または推奨する金融、投資、トレード、その他のアドバイスや推奨を意図するものではなく、それらを構成するものでもありません。詳細は利用規約をご覧ください。