OPEN-SOURCE SCRIPT
BDC - Bitcoin (BTC) Dominance Change [Logue]
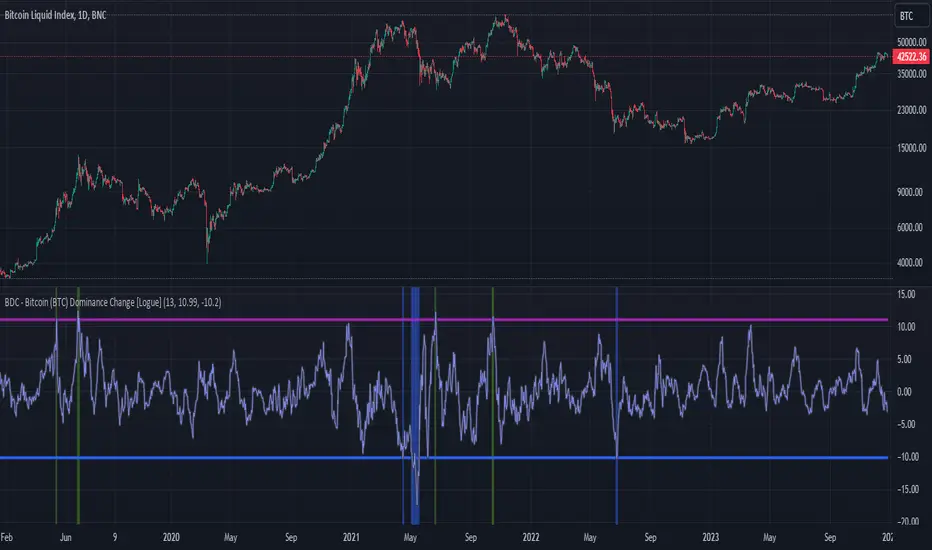
Bitcoin Dominance Change. Interesting things tend to happen when the Bitcoin dominance increases or decreases rapidly. Perhaps because there is overexuberance in the market in either BTC or the alts. In back testing, I found a rapid 13-day change in dominance indicates interesting switches in the BTC trends. Prior to 2019, the indicator doesn't work as well to signal trend shifts (i.e., local tops and bottoms) likely based on very few coins making up the crypto market.
The BTC dominance change is calculated as a percentage change of the daily dominance. You are able to change the upper bound, lower bound, and the period (daily) of the indicator to your own preferences. The indicator going above the upper bound or below the lower bound will trigger a different background color.
Use this indicator at your own risk. I make no claims as to its accuracy in forecasting future trend changes of Bitcoin.
オープンソーススクリプト
TradingViewの精神に則り、このスクリプトの作者はコードをオープンソースとして公開してくれました。トレーダーが内容を確認・検証できるようにという配慮です。作者に拍手を送りましょう!無料で利用できますが、コードの再公開はハウスルールに従う必要があります。
免責事項
この情報および投稿は、TradingViewが提供または推奨する金融、投資、トレード、その他のアドバイスや推奨を意図するものではなく、それらを構成するものでもありません。詳細は利用規約をご覧ください。
オープンソーススクリプト
TradingViewの精神に則り、このスクリプトの作者はコードをオープンソースとして公開してくれました。トレーダーが内容を確認・検証できるようにという配慮です。作者に拍手を送りましょう!無料で利用できますが、コードの再公開はハウスルールに従う必要があります。
免責事項
この情報および投稿は、TradingViewが提供または推奨する金融、投資、トレード、その他のアドバイスや推奨を意図するものではなく、それらを構成するものでもありません。詳細は利用規約をご覧ください。