OPEN-SOURCE SCRIPT
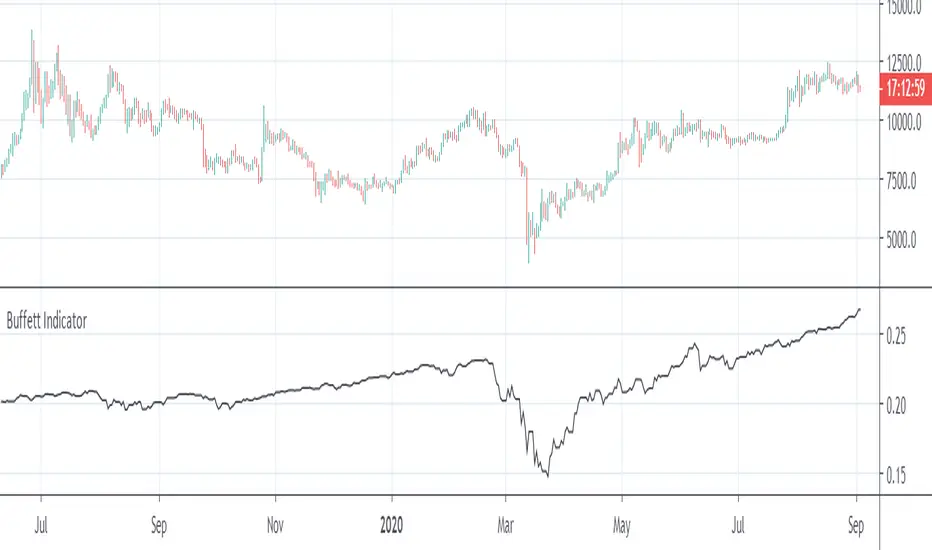
Buffett Indicator [Bitcoin Machine]

This is the Warren Buffett Indicator, the total market cap relative to the US gross domestic product (GDP). It is also called "Market Cap to GDP Indicator". For the market cap typically the Wilshire 5000 total market cap is used, which is representing the value of all stocks traded in the United States. Tradingview just provides the Wilshire W4500. We can calculate the W5000 by adding the S&P500 to the W4500.
Market Cap to GDP is a long-term valuation indicator and as pointed by Warren Buffett, the indicator is “probably the best single measure of where valuations stand at any given moment.” It used as a broad way of assessing whether the country’s stock market is overvalued or undervalued, compared to a historical average.
Remark: The Wilshire W4500 and the S&P500 are indices and denoted in "index points" (not USD). The Original Buffett Indicator is using market cap in US-Dollar. So the right scale of the indicator is different to the original one.
オープンソーススクリプト
TradingViewの精神に則り、このスクリプトの作者はコードをオープンソースとして公開してくれました。トレーダーが内容を確認・検証できるようにという配慮です。作者に拍手を送りましょう!無料で利用できますが、コードの再公開はハウスルールに従う必要があります。
免責事項
この情報および投稿は、TradingViewが提供または推奨する金融、投資、トレード、その他のアドバイスや推奨を意図するものではなく、それらを構成するものでもありません。詳細は利用規約をご覧ください。
オープンソーススクリプト
TradingViewの精神に則り、このスクリプトの作者はコードをオープンソースとして公開してくれました。トレーダーが内容を確認・検証できるようにという配慮です。作者に拍手を送りましょう!無料で利用できますが、コードの再公開はハウスルールに従う必要があります。
免責事項
この情報および投稿は、TradingViewが提供または推奨する金融、投資、トレード、その他のアドバイスや推奨を意図するものではなく、それらを構成するものでもありません。詳細は利用規約をご覧ください。