INVITE-ONLY SCRIPT
Rfactory: Ken Long MACD Seasons
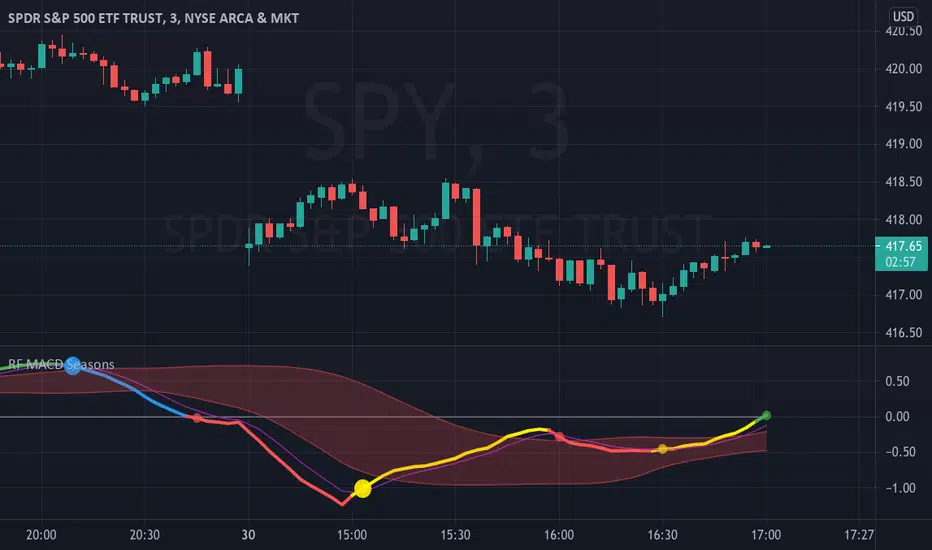
Rfactory has partnered with Dr Ken Long of Tortoise Capital Management to provide his MACD Seasons Indicator which is loaded into its own sub-graph. All settings are preconfigured to be the same as Dr Long uses out of the box and the plots include the MACD line colored by Season, the Signal line and the Red River. SSC (Spring Supported Crossing) Signals are specifically highlighted with large Dots on the MACD Line. Everything is customizable including not only coloring and line styles but also the underlying settings for lookbacks as well as a selector to use SMA's or EMA's for the calculations.
The MACD Seasons indicator helps identify where a market is in a seasonal cycle. In summer (green) the market is trending up and at an expanding pace. Once the season changes to Fall (blue) the market is still trending up but the pace has slowed. When the market moves into Winter (red) the trend has changed to down and at a quickening pace. In Spring (yellow) the trend is still down but the pace has slowed and we are looking ahead to get back to Summer.
The Red River volatility band is an indication of normal and helps identify in particular when a market is in a particularly harsh winter or summer.
The MACD Seasons works best with (and is an extension of) Dr Long's RLCO Framework.
招待専用スクリプト
このスクリプトへのアクセスは作者が許可したユーザーに制限されており、通常はお支払いが必要です。お気に入りに追加することはできますが、許可を申請して作者が許可した後でなければ使用することはできません。 詳細については JeffBoccaccio にお問い合わせいただくか、以下の作者の指示に従ってください。
スクリプトの動作を理解していて作者も100%信頼できるということでなければ、TradingViewとしてはお金を払ってまでスクリプトを利用するのはお勧めしません。そのかわりに、コミュニティスクリプトでオープンソースの優れたスクリプトが無料で見つけられることが多々あります。
作者の指示
″For access to this indicator please contact Rfactory via PM, http://www.rfactory.io or email info@rfactory.io
チャートでこのスクリプトを利用したいですか?
注: アクセス権をリクエストされる前にこちらをご覧ください。
免責事項
これらの情報および投稿は、TradingViewが提供または保証する金融、投資、取引、またはその他の種類のアドバイスや推奨を意図したものではなく、またそのようなものでもありません。詳しくは利用規約をご覧ください。