OPEN-SOURCE SCRIPT
Current RSI vs Sector RSI Comparison
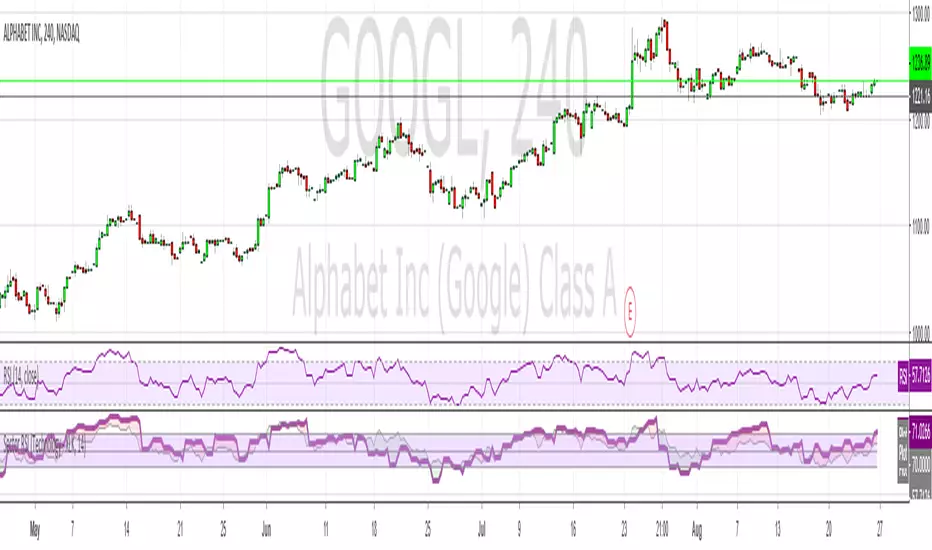
In the example above GOOGL's RSI is being compared against the RSI for XLK, the technology sector fund. The red and green areas make it easy to see if Google is under or overperforming relative to other tech stocks. I've included a normal RSI above it for comparison.
You can compare any stock to a sector, i.e. JP Morgan (JPM) versus the financial sector (XLF), or whatever your heart desires. All major sectors are selectable from a drop-down box and the output can also be visualised as a histogram too, much like a MACD.
You can compare any stock to a sector, i.e. JP Morgan (JPM) versus the financial sector (XLF), or whatever your heart desires. All major sectors are selectable from a drop-down box and the output can also be visualised as a histogram too, much like a MACD.
オープンソーススクリプト
TradingViewの精神に則り、このスクリプトの作者はコードをオープンソースとして公開してくれました。トレーダーが内容を確認・検証できるようにという配慮です。作者に拍手を送りましょう!無料で利用できますが、コードの再公開はハウスルールに従う必要があります。
免責事項
この情報および投稿は、TradingViewが提供または推奨する金融、投資、トレード、その他のアドバイスや推奨を意図するものではなく、それらを構成するものでもありません。詳細は利用規約をご覧ください。
オープンソーススクリプト
TradingViewの精神に則り、このスクリプトの作者はコードをオープンソースとして公開してくれました。トレーダーが内容を確認・検証できるようにという配慮です。作者に拍手を送りましょう!無料で利用できますが、コードの再公開はハウスルールに従う必要があります。
免責事項
この情報および投稿は、TradingViewが提供または推奨する金融、投資、トレード、その他のアドバイスや推奨を意図するものではなく、それらを構成するものでもありません。詳細は利用規約をご覧ください。