OPEN-SOURCE SCRIPT
更新済 CME Gap Oscillator [CryptoSea]

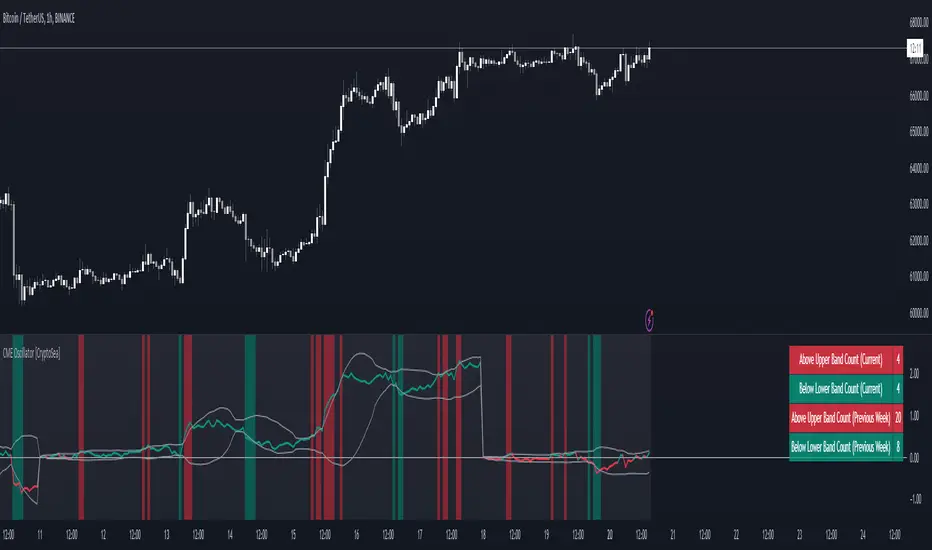
Introducing the CME Gap Oscillator, a pioneering tool designed to illuminate the significance of market gaps through the lens of the Chicago Mercantile Exchange (CME). By leveraging gap sizes in relation to the Average True Range (ATR), this indicator offers a unique perspective on market dynamics, particularly around the critical weekly close periods.

Key Features

Settings & Customisation
In the example below, it demonstrates that the CME will want to return to the 0 value, this would be considered a reset or gap fill.

Application & Strategy
Deploy the CME Oscillator to enhance your market analysis
The CME Oscillator stands out as a strategic tool for traders focusing on gap analysis and volatility assessment. By offering a detailed breakdown of market gaps in relation to volatility, it empowers users with actionable insights, enabling more informed trading decisions across a range of markets and timeframes.
Key Features
- Gap Measurement: At its core, the CME Oscillator quantifies the size of weekend gaps in the context of the market's volatility, using the ATR to standardize this measurement.
- Dynamic Levels: Incorporating a dynamic extreme level calculation, the tool adapts to current market conditions, providing real-time insights into significant gap sizes and their implications.
- Band Analysis: Through the introduction of upper and lower bands, based on standard deviations, traders can visually assess the oscillator's position relative to typical market ranges.
- Enhanced Insights: A built-in table tracks the frequency of the oscillator's breaches beyond these bands within the latest CME week, offering a snapshot of recent market extremities.
Settings & Customisation
- ATR-Based Measurement: Choose to measure gap sizes directly or in terms of ATR for a volatility-adjusted view.
- Band Period Adjustability: Tailor the oscillator's sensitivity by modifying the band calculation period.
- Dynamic Level Multipliers: Adjust the multiplier for dynamic levels to suit your analysis needs.
- Visual Preferences: Customise the oscillator, bands, and table visuals, including color schemes and line styles.
In the example below, it demonstrates that the CME will want to return to the 0 value, this would be considered a reset or gap fill.
Application & Strategy
Deploy the CME Oscillator to enhance your market analysis
- Market Sentiment: Gauge weekend market sentiment shifts through gap analysis, refining your strategy for the week ahead.
- Volatility Insights: Use the oscillator's ATR-based measurements to understand the volatility context of gaps, aiding in risk management.
- Trend Identification: Identify potential trend continuations or reversals based on the frequency and magnitude of gaps exceeding dynamic levels.
The CME Oscillator stands out as a strategic tool for traders focusing on gap analysis and volatility assessment. By offering a detailed breakdown of market gaps in relation to volatility, it empowers users with actionable insights, enabling more informed trading decisions across a range of markets and timeframes.
リリースノート
New Calculation Method for Oscillator:- The oscillator now resets every Saturday at 00:00 and calculates the gap size from the open of the first Saturday candle.
- This ensures the oscillator starts at 0 on the first Saturday candle and measures the change from this point onward, providing a more accurate reflection of weekly gaps.
Dynamic Band Calculation:
- Bands and dynamic extreme levels are now recalculated starting from the first Saturday candle.
- This dynamic adjustment ensures the bands reflect the most recent price action accurately.
Enhanced Table Display:
- []The table now displays both the current week's and the previous week's counts of oscillator crossings above the upper band and below the lower band.
[]This provides a comprehensive view of the oscillator's behavior across different weeks.
Updated Reset Logic:
- Counts for oscillator crossings are reset at the start of the CME week (Monday at 00:00) and on the first candle of Saturday.
- Previous week's counts are stored and displayed in the table for better comparison and analysis.
This update provides a more accurate and dynamic measure of price gaps on a weekly basis. The inclusion of previous week's data in the table helps traders compare and analyze weekly trends more effectively.
リリースノート
Added Option to enable/disable table display.リリースノート
Minor bug fixオープンソーススクリプト
TradingViewの精神に則り、このスクリプトの作者はコードをオープンソースとして公開してくれました。トレーダーが内容を確認・検証できるようにという配慮です。作者に拍手を送りましょう!無料で利用できますが、コードの再公開はハウスルールに従う必要があります。
Create Your Capital
免責事項
この情報および投稿は、TradingViewが提供または推奨する金融、投資、トレード、その他のアドバイスや推奨を意図するものではなく、それらを構成するものでもありません。詳細は利用規約をご覧ください。
オープンソーススクリプト
TradingViewの精神に則り、このスクリプトの作者はコードをオープンソースとして公開してくれました。トレーダーが内容を確認・検証できるようにという配慮です。作者に拍手を送りましょう!無料で利用できますが、コードの再公開はハウスルールに従う必要があります。
Create Your Capital
免責事項
この情報および投稿は、TradingViewが提供または推奨する金融、投資、トレード、その他のアドバイスや推奨を意図するものではなく、それらを構成するものでもありません。詳細は利用規約をご覧ください。