OPEN-SOURCE SCRIPT
USDT+USDC+BUSD Market Cap
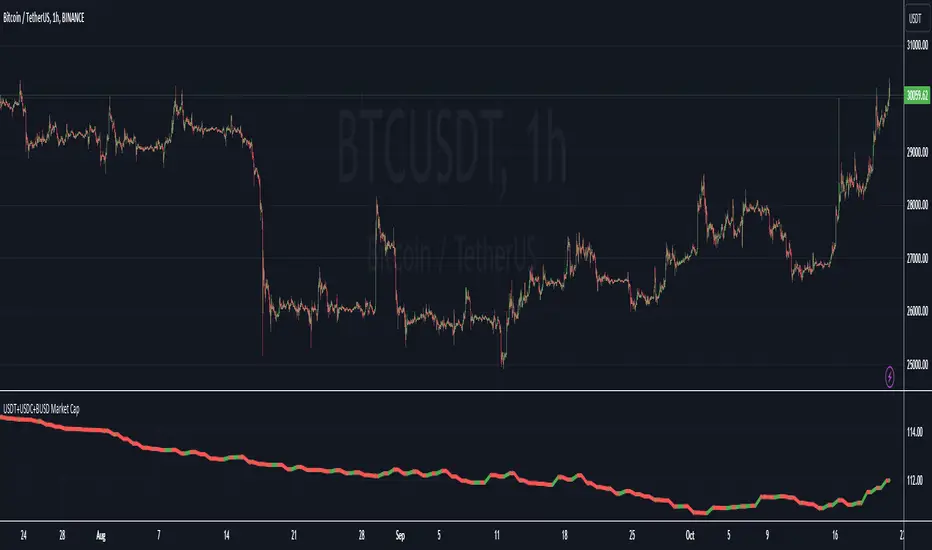
This Pine Script indicator visualizes the combined market capitalization of three prominent stablecoins: USDT, USDC, and BUSD, on a daily basis.
It fetches the daily closing market caps of these stablecoins and sums them. The resulting line graph is displayed in its own separate pane below the main price chart.
The line is color-coded: green on days when the market cap is increasing compared to the previous day, and red when it's decreasing.
オープンソーススクリプト
TradingViewの精神に則り、このスクリプトの作者はコードをオープンソースとして公開してくれました。トレーダーが内容を確認・検証できるようにという配慮です。作者に拍手を送りましょう!無料で利用できますが、コードの再公開はハウスルールに従う必要があります。
免責事項
この情報および投稿は、TradingViewが提供または推奨する金融、投資、トレード、その他のアドバイスや推奨を意図するものではなく、それらを構成するものでもありません。詳細は利用規約をご覧ください。
オープンソーススクリプト
TradingViewの精神に則り、このスクリプトの作者はコードをオープンソースとして公開してくれました。トレーダーが内容を確認・検証できるようにという配慮です。作者に拍手を送りましょう!無料で利用できますが、コードの再公開はハウスルールに従う必要があります。
免責事項
この情報および投稿は、TradingViewが提供または推奨する金融、投資、トレード、その他のアドバイスや推奨を意図するものではなく、それらを構成するものでもありません。詳細は利用規約をご覧ください。