OPEN-SOURCE SCRIPT
更新済 TNT_Upgraded
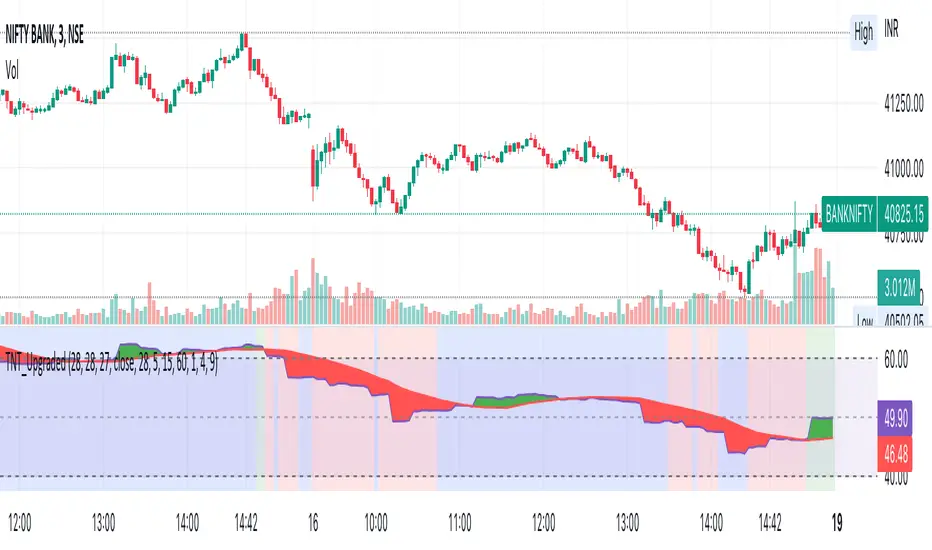
The background of the indicator to show TrendingUp (Green) / TrendingDown (Red) / Range Bound (Blue) Regions.
The concept is very simple, at each candle we look at the size of the candle and use a moving average of these candle body size (ABS (close-open)) and compare it agains a double smoothened average, i.e. moving average of this average to find trending or not trending periods.
In the upgrade the moving average is now looking only at the current day for intraday timeframe, i.e. in the first 5 bars it is an average of last 5 values, for last 10 candles it is an average of 10 values with the max limited to 28 that is for candle 28 onwards the average is always for 28 candles for default values or as defined by user.
I find it useful primarily for entry in options, a green background is more favourable for call option buying, a red background is favourable for put option buying and blue background is more favourable for option selling.
The coloured ranges show the direction bias, this has been designed using RSI on 3 timeframes with different weight-ages, all customisable by the user.
PS, I only trade Bank Nifty for intraday, all my observations are driven only by Bank Nifty.
リリースノート
Minor code changesオープンソーススクリプト
TradingViewの精神に則り、このスクリプトの作者はコードをオープンソースとして公開してくれました。トレーダーが内容を確認・検証できるようにという配慮です。作者に拍手を送りましょう!無料で利用できますが、コードの再公開はハウスルールに従う必要があります。
免責事項
この情報および投稿は、TradingViewが提供または推奨する金融、投資、トレード、その他のアドバイスや推奨を意図するものではなく、それらを構成するものでもありません。詳細は利用規約をご覧ください。
オープンソーススクリプト
TradingViewの精神に則り、このスクリプトの作者はコードをオープンソースとして公開してくれました。トレーダーが内容を確認・検証できるようにという配慮です。作者に拍手を送りましょう!無料で利用できますが、コードの再公開はハウスルールに従う必要があります。
免責事項
この情報および投稿は、TradingViewが提供または推奨する金融、投資、トレード、その他のアドバイスや推奨を意図するものではなく、それらを構成するものでもありません。詳細は利用規約をご覧ください。