OPEN-SOURCE SCRIPT
Stochastic PC [BigBitsIO]
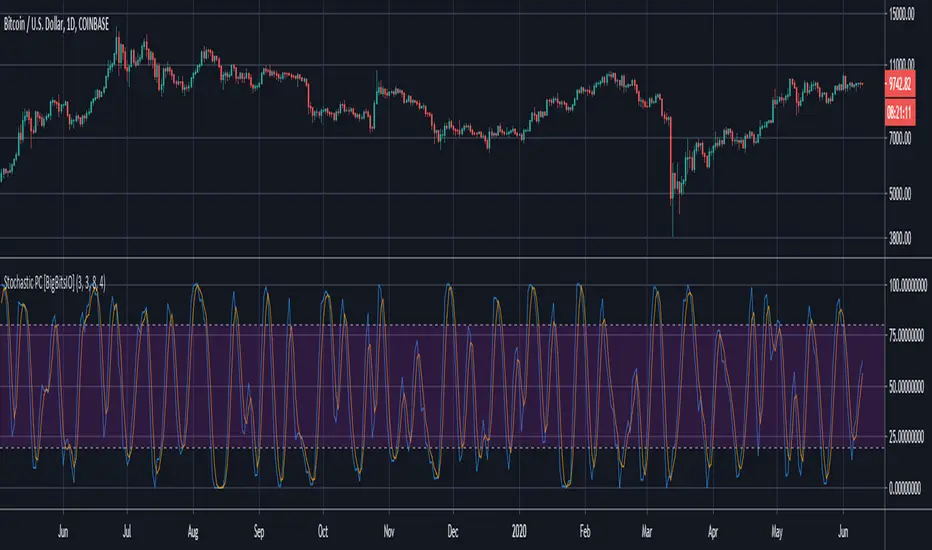
This script is a very simple stochastic calculation similar to Stochastic RSI that calculates a stochastic value of a moving average of the percentage price change. The purpose of the indicator is to find positive and negative volatility momentum peaks which might be able to help identify changes in trends. Like other stochastic indicators, it may be best used in combination with other indicators.
Explained:
- First gets the % change for the candle from open to close. Green candles produce positive values, red candles produce negative values.
- Then it creates a moving average of that number to try and reduce impacts of very large moves, although this can be changed with the super-fast smoothed length setting. Set it to 1 to remove all smoothing.
- After that, it creates a K value using a stochastic calculation based on the range of the price change moving average we created in the previous step. Set the smoothK to one to use a fast stochastic calculation, it is a slow stochastic calculation by default (3-period SMA of stochastic)
- Finally, to create the D value it calculates a 3-period SMA of the K value.
FAQ:
- Why is this script useful?
- This script can help identify the peaks and valleys of volatility momentum
DISCLAIMER: For educational and entertainment purposes only. Nothing in this content should be interpreted as financial advice or a recommendation to buy or sell any sort of security or investment including all types of crypto. DYOR, TYOB.
オープンソーススクリプト
TradingViewの精神に則り、このスクリプトの作者はコードをオープンソースとして公開してくれました。トレーダーが内容を確認・検証できるようにという配慮です。作者に拍手を送りましょう!無料で利用できますが、コードの再公開はハウスルールに従う必要があります。
Like and follow!
💻 Website: bigbits.io
📺 YouTube: youtube.com/bigbits
🎮 Discord: discord.gg/rapMn4z
🐦 Twitter: twitter.com/BigBitsIO
💸 Save $30 on TradingView Paid Plan: bit.ly/2CaRfjs
💻 Website: bigbits.io
📺 YouTube: youtube.com/bigbits
🎮 Discord: discord.gg/rapMn4z
🐦 Twitter: twitter.com/BigBitsIO
💸 Save $30 on TradingView Paid Plan: bit.ly/2CaRfjs
免責事項
この情報および投稿は、TradingViewが提供または推奨する金融、投資、トレード、その他のアドバイスや推奨を意図するものではなく、それらを構成するものでもありません。詳細は利用規約をご覧ください。