OPEN-SOURCE SCRIPT
RSI Projection v1
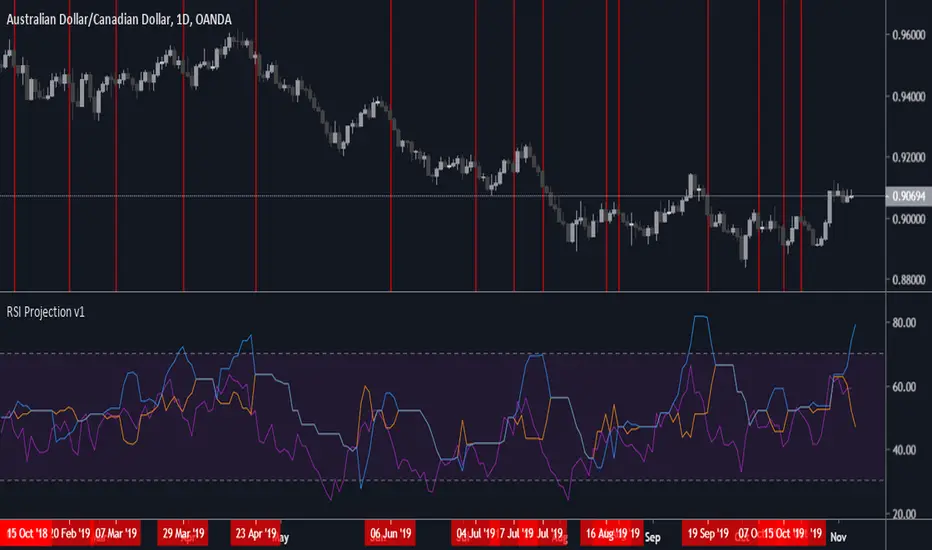
Application of concepts from Constance Brown "Technical Analysis for Trading Professionals", specifically: Chapter 7: Price Projections By Reverse Engineering Indicators, and Chapter 8: Price Objectives Derived From Positive and Negative Reversals In The RSI.
Specifically: I wanted to see if better Exit signals for the RSI could be generated from a basic application of some of the concepts in those chapters, and that is what I've found so far:
Specifically: I wanted to see if better Exit signals for the RSI could be generated from a basic application of some of the concepts in those chapters, and that is what I've found so far:
- Exit when the RSI (purple) crosses below the orange line
- Orange line is forecasted RSI for positive price reversals, blue line is forecasted RSI for negative price reversals
- From what I can tell, this indicator does not work well during chop/consolidation and ranging periods, generating too many false signals without additional confluence from trending indicators and price analysis
- This indicator should be considered highly experimental - do not use live trading without proper backtesting and parameter adjustment.
- Tuning per asset and timeframe is required due to calculation type for highs/lows used for projection calculations
オープンソーススクリプト
TradingViewの精神に則り、このスクリプトの作者はコードをオープンソースとして公開してくれました。トレーダーが内容を確認・検証できるようにという配慮です。作者に拍手を送りましょう!無料で利用できますが、コードの再公開はハウスルールに従う必要があります。
免責事項
この情報および投稿は、TradingViewが提供または推奨する金融、投資、トレード、その他のアドバイスや推奨を意図するものではなく、それらを構成するものでもありません。詳細は利用規約をご覧ください。
オープンソーススクリプト
TradingViewの精神に則り、このスクリプトの作者はコードをオープンソースとして公開してくれました。トレーダーが内容を確認・検証できるようにという配慮です。作者に拍手を送りましょう!無料で利用できますが、コードの再公開はハウスルールに従う必要があります。
免責事項
この情報および投稿は、TradingViewが提供または推奨する金融、投資、トレード、その他のアドバイスや推奨を意図するものではなく、それらを構成するものでもありません。詳細は利用規約をご覧ください。