INVITE-ONLY SCRIPT
MostPower MagicBox - Premium
アップデート済
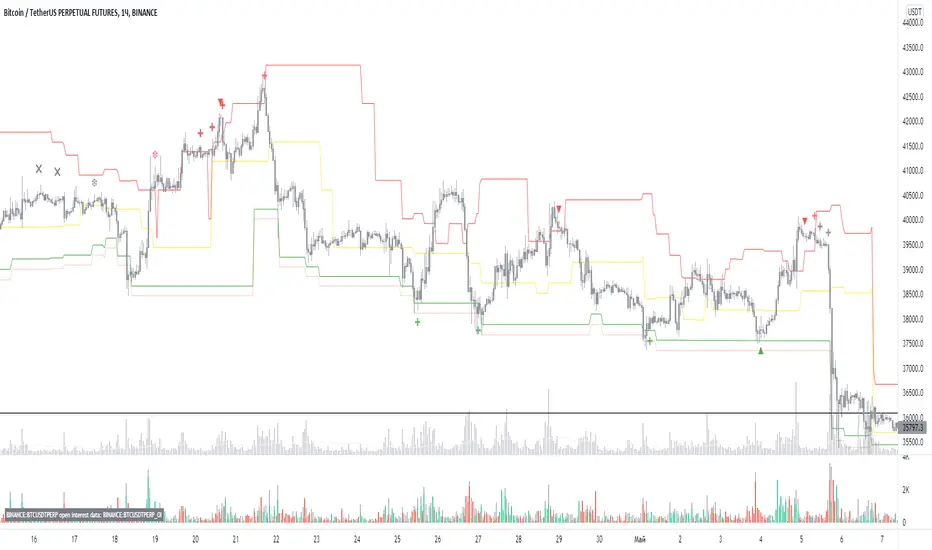
MostPower MagicBox - Premium - This indicator is designed to find support and resistance levels in real time.
How to use ?
Yellow line - This is the main level
The red and green lines are the boundaries of the main level.
You can enter a deal both from the main level and from its border, which is a safer deal.
In the settings, you can select the mode of operation of the levels you need, the timeframe for the calculation and configure it as you need.
It is important to understand that this must be used by everyone in a company with an overall trading strategy.
Settings:
There are three types of quality levels
Weak - displays weaker levels suitable for shorter-term trades.
Medium - displays average quality levels, suitable for more average deals.
Strong - displays strong quality levels, suitable for longer trades (recommended).
Timeframe
In the Timeframe settings you can select the desired timeframe for the calculation.
Traps
Short squeeze from below (long ones not in traps)
Sellers ran into the boundaries of the red line. A balance to lower prices began to form. This is the end of the trend continuation. If we decode the data correctly, it will indicate to us that the market agrees to a decline.
The fact that a strong main (yellow) level is formed below and the price is below it indicates that the market is not interested in taking profit. Therefore, any potential rebound is likely to cause sellers to rapidly increase their short positions. This is a pattern that can lead to a slight pullback before the trend continues.
Short top pull (long into traps)
All of the buyers at the top who contributed to the increase in value are now trapped, which means that any bounce to the major (yellow) level is an interesting proposition to add short positions, especially if it is orphaned by the main trend.
Unlike a downtrend structure, this short tends to bounce more as market participants cannot find a good spot. This ultimately leads to exhaustion before a potential price recovery (expected rebound) within the market pricing mechanism. When this pattern occurs, any continuation of the decline without a prior bounce carries the risk of exhaustion and capture of slow and weak sellers, unless there is a significant increase in the value of these newly formed lower prices.
Below I will show one of the possible nuances that you may encounter.
We see that the red line has accumulated many buyers, but they could not make up some value in combination with the closing of the price below the main (yellow) level, it screams about danger.
Long Bottom Zip (Shorts in Traps)
Unlike in the past, we now find ourselves with a bullish structure forming a downward squeeze.
When this happens, our hypothesis should always be that until new pockets of liquidity are created for the longs at these highs, this type of structure will run the risk that the move will end (exhaustion), leading to a strong pullback. It is in this type of retracement that we can see the best opportunities for long as price returns to retest the area in which sellers were trapped earlier.
Long top zip (no shorts in traps)
In this situation, there is a risk of an immediate continuation of the trend. If you look at the example graph below, this is exactly the case when buyers will not be overwhelmed by the imbalance in the supply.
Despite the backward environment, the environment will still be favorable for the search for buying opportunities as the latest data suggests that both buyers and sellers have agreed to higher price levels.
When these structures emerge, buyers who have maintained such a high price are not going to give up without a fight, and this is where downturn buying opportunities tend to arise. This pattern tends to create an initial false move that depletes itself before price magnetically pulls back to the previous major (yellow) level where the next battle will take place.
Putting it all together
We have come to the end of this tutorial. Remember, you must consider these new concepts as part of a holistic approach to markets. If you don't understand your surroundings without doing proper multi-timeframe research, you may be missing out on some of the picture.
リリースノート
- Fixリリースノート
- Fix bugsリリースノート
- Fix bugsリリースノート
- Update to Pine Script 5リリースノート
- Fixed Bugsリリースノート
- Fix bugsリリースノート
- Fix bugsリリースノート
- Fix Bugsリリースノート
-Fix bugsリリースノート
- Fix bugsリリースノート
- Fix bugsリリースノート
- Fix bugs招待専用スクリプト
このスクリプトへのアクセスは作者が許可したユーザーに制限されており、通常はお支払いが必要です。お気に入りに追加することはできますが、許可を申請して作者が許可した後でなければ使用することはできません。 詳細については mostpower-app にお問い合わせいただくか、以下の作者の指示に従ってください。
スクリプトの動作を理解していて作者も100%信頼できるということでなければ、TradingViewとしてはお金を払ってまでスクリプトを利用するのはお勧めしません。そのかわりに、コミュニティスクリプトでオープンソースの優れたスクリプトが無料で見つけられることが多々あります。
作者の指示
″Get instant access to our premium indicators: https://mostpower.app/
チャートでこのスクリプトを利用したいですか?
注: アクセス権をリクエストされる前にこちらをご覧ください。
免責事項
これらの情報および投稿は、TradingViewが提供または保証する金融、投資、取引、またはその他の種類のアドバイスや推奨を意図したものではなく、またそのようなものでもありません。詳しくは利用規約をご覧ください。