OPEN-SOURCE SCRIPT
更新済 Fisher Multi-Pack [DW]
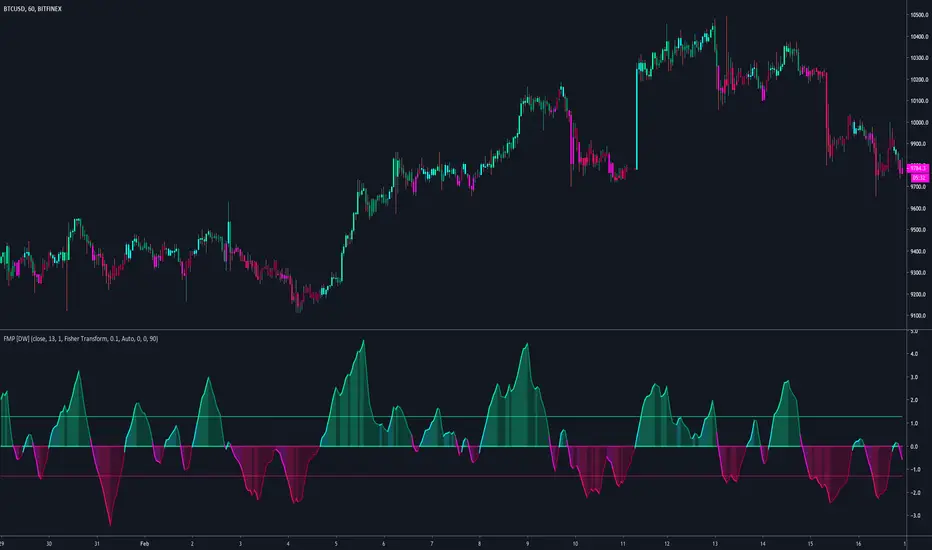
This is an experimental study designed to visualize price activity using John Ehlers Fisher Transform and Inverse Fisher Transform methods.
The Ehlers Fisher Transform is a variation of R. A. Fisher's Z transformation.
In this study, there are five oscillator types to choose from:
-Fisher Transform Indicator - A conversion of price's probability distribution to a Gaussian normal distribution with a smoother output
-Inverse Fisher Relative Strength Index - Converts the RSI's distribution to a bounded distribution between 1 and -1 with a smoother output
-Inverse Fisher Stochastic Oscillator - Converts the Stochastic's distribution to a bounded distribution between 1 and -1 with a smoother output
-Inverse Fisher Commodity Channel Index - Converts the CCI's distribution to a bounded distribution between 1 and -1 with a smoother output
-Inverse Fisher Blast Off Momentum - Converts the BOM's distribution to a bounded distribution between 1 and -1 with a smoother output
The study uses a modified set of Bollinger Bands applied to the chosen oscillator to determine trend and impulse activity, which are highlighted by the color scheme.
Custom bar colors are included.
リリースノート
Updates:Cleaned up the script. Removed clutter.
Removed Inverse Fisher BOM from the oscillator types due to an excessive amount of false readings.
Thresholds are no longer Bollinger Bands. Instead, they are calculated using a cumulative average of the oscillator's deviation from 0.
Minor aesthetic changes.
リリースノート
Updates:-> Reorganized script structure.
-> Main calculations are now expressed as functions.
-> Added custom threshold inputs.
-> Added an option to compress the oscillator around thresholds by a specified level of intensity. (Most useful with Fisher Transform oscillator type.)
-> Revamped color scheme.
オープンソーススクリプト
TradingViewの精神に則り、このスクリプトの作者はコードをオープンソースとして公開してくれました。トレーダーが内容を確認・検証できるようにという配慮です。作者に拍手を送りましょう!無料で利用できますが、コードの再公開はハウスルールに従う必要があります。
For my full list of premium tools, check the blog:
wallanalytics.com/
Reach out on Telegram:
t.me/DonovanWall
wallanalytics.com/
Reach out on Telegram:
t.me/DonovanWall
免責事項
この情報および投稿は、TradingViewが提供または推奨する金融、投資、トレード、その他のアドバイスや推奨を意図するものではなく、それらを構成するものでもありません。詳細は利用規約をご覧ください。