OPEN-SOURCE SCRIPT
Aroon Histogram + CMO [ChuckBanger]
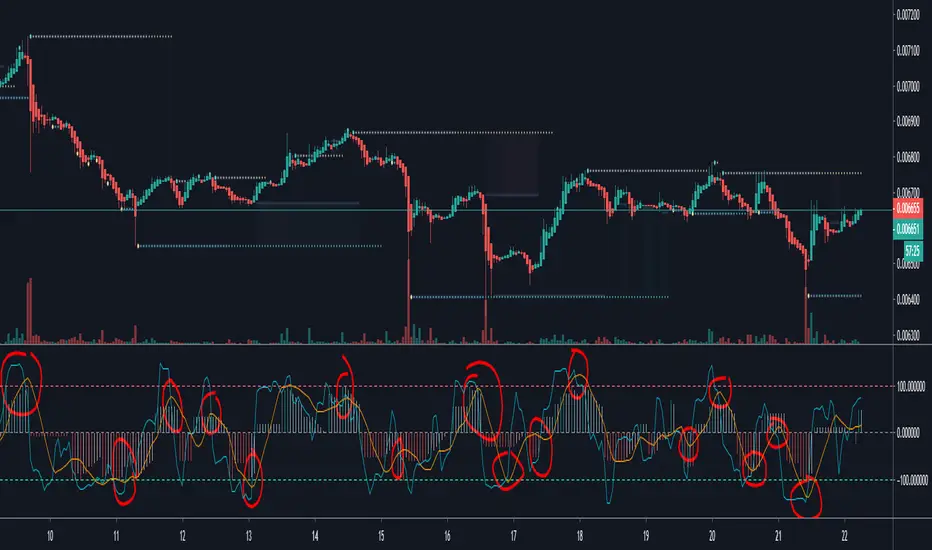
This is a combination of Aroon and Chande Momentum Oscillator . I made a histogram of Aroon , aqua line is Chande Momentum and the orange line are a simple moving average of Chande Momentum as a signal line.
One strategy you can use this for is to buy or sell when the signal line crosses the CM line or you can buy and sell when CM line is highest or lowest
You should also study how the indicators work separately:
Aroon Oscillator
investopedia.com/terms/a/aroonoscillator.asp
Chande Momentum Oscillator
investopedia.com/terms/c/chandemomentumoscillator.asp
オープンソーススクリプト
TradingViewの精神に則り、このスクリプトの作者はコードをオープンソースとして公開してくれました。トレーダーが内容を確認・検証できるようにという配慮です。作者に拍手を送りましょう!無料で利用できますが、コードの再公開はハウスルールに従う必要があります。
Tip jar, if you want to support my indicators work
BTC: 3EV8QGKK689kToo1r8pZJXbWDqzyJQtHy6
LTC: LRAikFVtnqY2ScJUR2ETJSG4w9t8LcmSdh
BTC: 3EV8QGKK689kToo1r8pZJXbWDqzyJQtHy6
LTC: LRAikFVtnqY2ScJUR2ETJSG4w9t8LcmSdh
免責事項
この情報および投稿は、TradingViewが提供または推奨する金融、投資、トレード、その他のアドバイスや推奨を意図するものではなく、それらを構成するものでもありません。詳細は利用規約をご覧ください。