OPEN-SOURCE SCRIPT
WaveTrend and Crossing EMA of RSIs by Alhazen
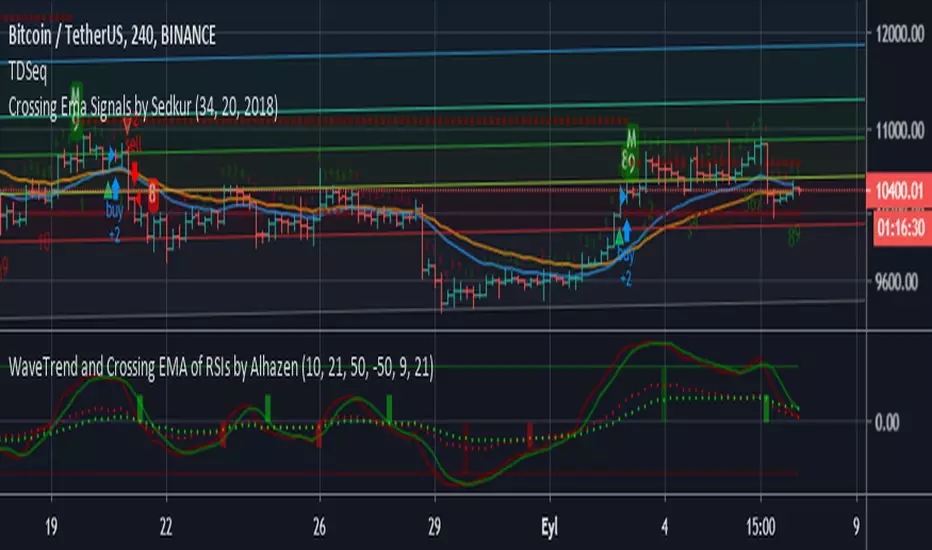
LazyBear's WaveTrend Oscilator is simplified, and buy & sell signals are added. Green bars indicate SELL signal of WT, and Maroon bars indicate BUY signal of WT.
A new indicator added: Crossing EMA of two RSI's. RSI plots are shown with dotted lines. Lime bars indicate SELL signal of RSI, and Red bars indicate BUY signal of RSI.
You can combine WT and RSI together and decide to BUY or SELL.
A new indicator added: Crossing EMA of two RSI's. RSI plots are shown with dotted lines. Lime bars indicate SELL signal of RSI, and Red bars indicate BUY signal of RSI.
You can combine WT and RSI together and decide to BUY or SELL.
オープンソーススクリプト
TradingViewの精神に則り、このスクリプトの作者はコードをオープンソースとして公開してくれました。トレーダーが内容を確認・検証できるようにという配慮です。作者に拍手を送りましょう!無料で利用できますが、コードの再公開はハウスルールに従う必要があります。
免責事項
この情報および投稿は、TradingViewが提供または推奨する金融、投資、トレード、その他のアドバイスや推奨を意図するものではなく、それらを構成するものでもありません。詳細は利用規約をご覧ください。
オープンソーススクリプト
TradingViewの精神に則り、このスクリプトの作者はコードをオープンソースとして公開してくれました。トレーダーが内容を確認・検証できるようにという配慮です。作者に拍手を送りましょう!無料で利用できますが、コードの再公開はハウスルールに従う必要があります。
免責事項
この情報および投稿は、TradingViewが提供または推奨する金融、投資、トレード、その他のアドバイスや推奨を意図するものではなく、それらを構成するものでもありません。詳細は利用規約をご覧ください。