OPEN-SOURCE SCRIPT
Average Directional Index + MA (with Fill trend color)
Description
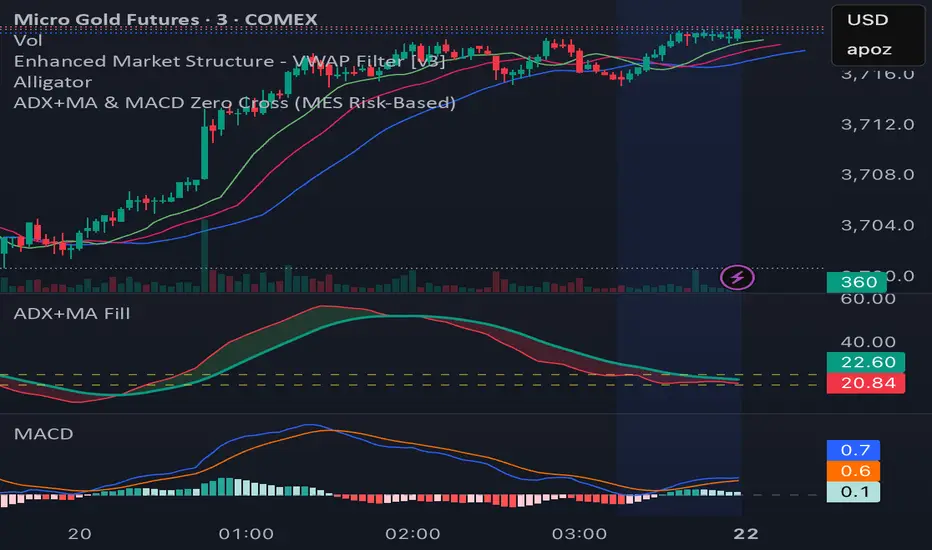
This indicator combines the Average Directional Index (ADX) with a configurable moving average (SMA, EMA, RMA, or WMA) and visual fill. It helps traders assess the strength of a trend by highlighting when ADX is above or below its moving average.
When ADX is rising above the MA, it suggests strengthening momentum; when falling below, it indicates weakening momentum. The dynamic green/red fill makes these transitions easy to spot.
Horizontal threshold levels at 20 and 25 are included as key references:
Below 20 → often signals ranging or sideways/consolidation markets.
Crossing above 20 or 25 → may suggest the beginning of a breakout or trend, useful for trend-following strategies.
How to use
Filter out sideways/consolidation phases and focus on breakout or trend-following opportunities when price action coincides with ADX crossing above the 20/25 thresholds.
Customization
ADX length & smoothing.
Moving average type and length.
Adjustable fill transparency.
Optional threshold lines at 20 and 25.
オープンソーススクリプト
TradingViewの精神に則り、この作者はスクリプトのソースコードを公開しているので、その内容を理解し検証することができます。作者に感謝です!無料でお使いいただけますが、このコードを投稿に再利用する際にはハウスルールに従うものとします。
免責事項
これらの情報および投稿は、TradingViewが提供または保証する金融、投資、取引、またはその他の種類のアドバイスや推奨を意図したものではなく、またそのようなものでもありません。詳しくは利用規約をご覧ください。
オープンソーススクリプト
TradingViewの精神に則り、この作者はスクリプトのソースコードを公開しているので、その内容を理解し検証することができます。作者に感謝です!無料でお使いいただけますが、このコードを投稿に再利用する際にはハウスルールに従うものとします。
免責事項
これらの情報および投稿は、TradingViewが提供または保証する金融、投資、取引、またはその他の種類のアドバイスや推奨を意図したものではなく、またそのようなものでもありません。詳しくは利用規約をご覧ください。