INVITE-ONLY SCRIPT
Momentum Line
What is this?
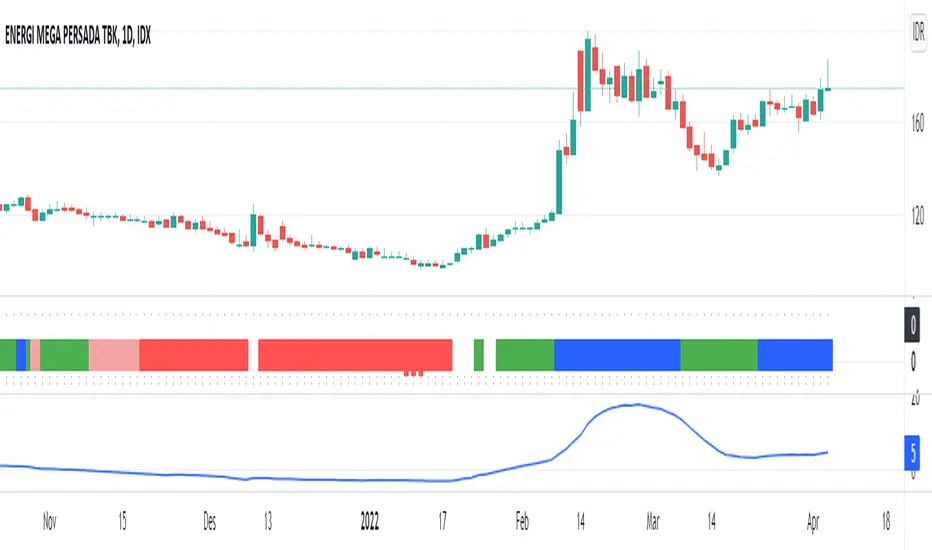
Momentum line (a blue line at the bottom area) tells you the short term trend movement of price. It will useful when the major trend is not developed-well. This line is not for a single use. We suggest you to use it with our other module: Trend Optimizer module, as shown above the momentum line.
Indicator & Strategies:
Momentum Line is based on moving average convergence divergence (MACD). We don't use the histogram, we don't concern the 2 lines crossing. So we blend the two lines into single lines.
See the charts, see the trend color (trend optimizer module) when it changed from long red color into white. It shows the medium trend changed from strong downtrend into neutral. But since the long term trend (the vertical trend bar below) is still not yet changed into green, the major trend (medium & long term) is still in development process. This is when we need to look at momentum line. If it pointing up, it gives confirmation that the uptrend is developing and you can buy the stocks using trend or swing strategies 9our profit trader module)
Benefit For you:
You can detect an early bottom reversal phase especially when you combine this momentum line script with out trend optimizer script.
招待専用スクリプト
このスクリプトへのアクセスは作者が許可したユーザーに制限されており、通常はお支払いが必要です。お気に入りに追加することはできますが、許可を申請して作者が許可した後でなければ使用することはできません。 詳細については galerisaham にお問い合わせいただくか、以下の作者の指示に従ってください。
スクリプトの動作を理解していて作者も100%信頼できるということでなければ、TradingViewとしてはお金を払ってまでスクリプトを利用するのはお勧めしません。そのかわりに、コミュニティスクリプトでオープンソースの優れたスクリプトが無料で見つけられることが多々あります。
作者の指示
″To use this scipt, visit https://galerisaham.com/modul for further information.
チャートでこのスクリプトを利用したいですか?
注: アクセス権をリクエストされる前にこちらをご覧ください。
We Build Profitable Traders | Visit: galerisaham.com/pro/
免責事項
これらの情報および投稿は、TradingViewが提供または保証する金融、投資、取引、またはその他の種類のアドバイスや推奨を意図したものではなく、またそのようなものでもありません。詳しくは利用規約をご覧ください。