OPEN-SOURCE SCRIPT
更新済 RSI, STOCHASTIC, KELTNER AND EMA CROSSES COMBINED
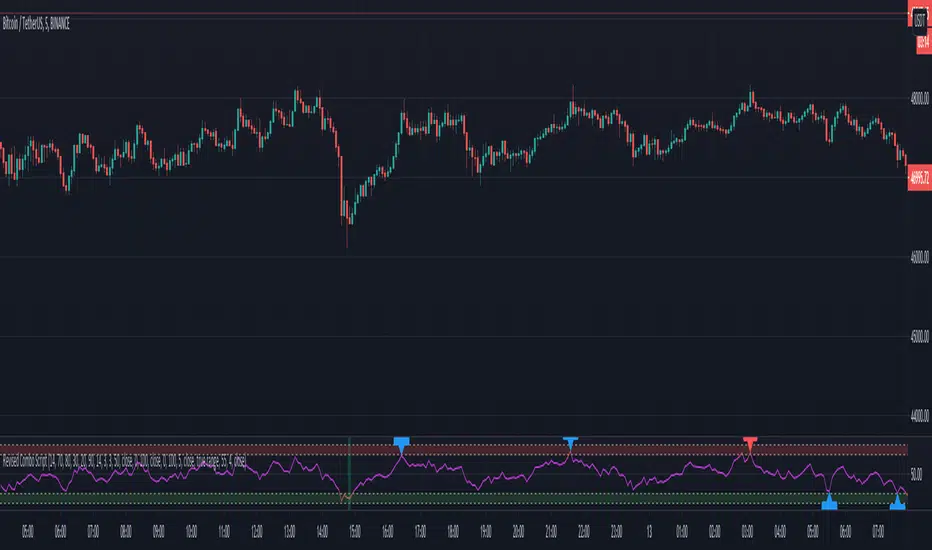
I have combined RSI and Stochastic but also added an keltner channel and then also two EMA's.
How the indicator works is the background turns green when the rsi and stochastic are below 20 and the keltner channel is below X and also your fast ema is below your slow ema and then vice versa for sell signals.
Feel free to leave a comment on what you think and what could be improved on it because i know their is some fine tuning to do and some improvement that can be made and I'm sure i'll be updating this myself.
All the variables are interchangable and the indicator has alert functionality.
リリースノート
Added Engulfing Candles, Hammer and Shooting Star candles and doji candles that can be seen with the appropriate arrow.リリースノート
*wrong chartリリースノート
Added divergences to the script and also added alerts(didnt realise i didnt have in the first place). Minor changes i have also changed the colours of the different candlestick patterns for easier recognition and removed the stochastic from the overlay to clear it all up. There will be more updates/improvements to come.
I hope you like it and if you have any suggestions please leave them in the comments
cheers
リリースノート
*cleared up screenshot*リリースノート
In this small update i have added MA/EMA Envelope indicator into the combination since it synergises well with Keltner channels i have also changed the rsi band into two bands highlighting the area between 20-30 with a green band and also 70-80 with a red band but i have also removed the candlestick labels as they were often cluttering the chart(Just remove the forward slashes from the plotshape variables at the bottom of the script to bring them back).I have also made the setting a lot easier to read and understand while also employing the ability to remove the different indicators from the combination.
I have left the settings as i use them which has mainly been lower timeframes and at the moment they are set on the 5 minute timeframe. The Envelope indicator has to be changed to suite yourself but also for the timeframe your using.
Since first publishing this script and slowly updating it, this indicator has been really good at finding reversals but i would not recommend trading the signals as soon as they pop up. Bullish and Bearish Divergence's will bring the price action further into overbought or oversold and can stop you out but i will update the script to accomodate for this in the future, so just be weary when the the buy and sell signals appear.
I hope you like my combination indicator.
Trade safe.
Cheers
オープンソーススクリプト
TradingViewの精神に則り、このスクリプトの作者はコードをオープンソースとして公開してくれました。トレーダーが内容を確認・検証できるようにという配慮です。作者に拍手を送りましょう!無料で利用できますが、コードの再公開はハウスルールに従う必要があります。
免責事項
この情報および投稿は、TradingViewが提供または推奨する金融、投資、トレード、その他のアドバイスや推奨を意図するものではなく、それらを構成するものでもありません。詳細は利用規約をご覧ください。
オープンソーススクリプト
TradingViewの精神に則り、このスクリプトの作者はコードをオープンソースとして公開してくれました。トレーダーが内容を確認・検証できるようにという配慮です。作者に拍手を送りましょう!無料で利用できますが、コードの再公開はハウスルールに従う必要があります。
免責事項
この情報および投稿は、TradingViewが提供または推奨する金融、投資、トレード、その他のアドバイスや推奨を意図するものではなく、それらを構成するものでもありません。詳細は利用規約をご覧ください。