OPEN-SOURCE SCRIPT
Put Call Oscillator
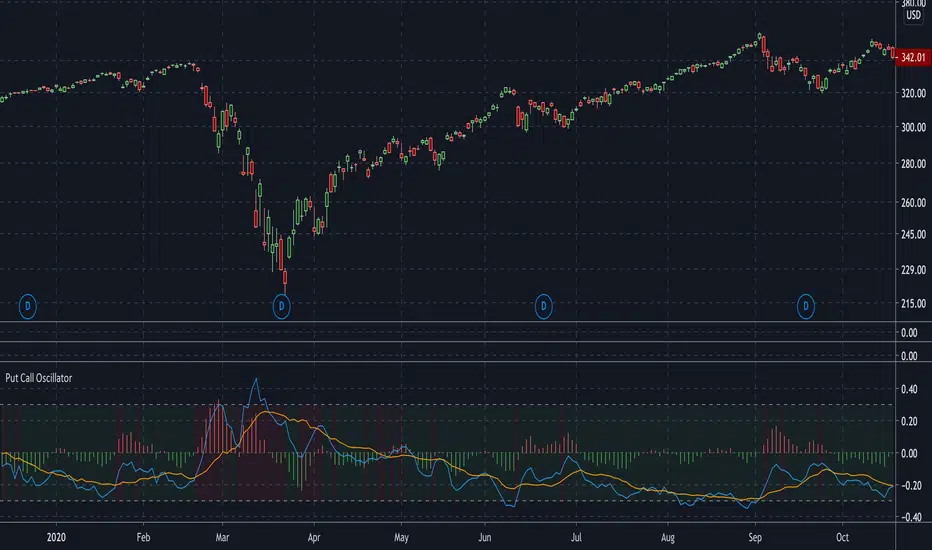
This is a volume-based oscillator used for detecting market sentiment.
This plots two moving averages of the CBOE S&P500 PCR (put call ratio), and a histogram to measure the distance between them. The histogram will generate signals of green (bullish) or red (bearish), depending on whether put volume is decreasing or increasing.
The moving averages are adjustable. They are set at 4 and 16 by default. Increasing the moving averages will generate less signals, while decreasing them will generate more signals.
The background will change color from red to green depending on whether the PCR is above or below 1.
I used capriole_charles script "Put/Call Ratio (PCR)" to help me build this.
オープンソーススクリプト
TradingViewの精神に則り、このスクリプトの作者はコードをオープンソースとして公開してくれました。トレーダーが内容を確認・検証できるようにという配慮です。作者に拍手を送りましょう!無料で利用できますが、コードの再公開はハウスルールに従う必要があります。
免責事項
この情報および投稿は、TradingViewが提供または推奨する金融、投資、トレード、その他のアドバイスや推奨を意図するものではなく、それらを構成するものでもありません。詳細は利用規約をご覧ください。
オープンソーススクリプト
TradingViewの精神に則り、このスクリプトの作者はコードをオープンソースとして公開してくれました。トレーダーが内容を確認・検証できるようにという配慮です。作者に拍手を送りましょう!無料で利用できますが、コードの再公開はハウスルールに従う必要があります。
免責事項
この情報および投稿は、TradingViewが提供または推奨する金融、投資、トレード、その他のアドバイスや推奨を意図するものではなく、それらを構成するものでもありません。詳細は利用規約をご覧ください。