OPEN-SOURCE SCRIPT
更新済 Trend Strength Indicator
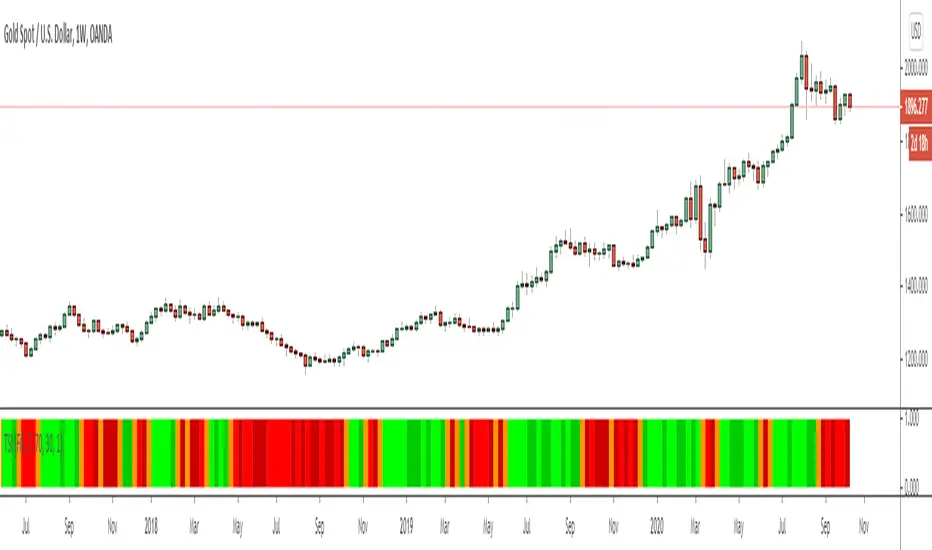
This indicator uses Heiken Ashi candle data to plot trend strength signals to your chart.
Bright Green: Heiken Ashi candle data is still putting in higher lows and higher highs, and the price closed above the previous low.
Dark Green: Heiken Ashi candle closed green, but had a lower low or lower high (trend weakening).
Bright Red: Heiken Ashi candle data is still putting in lower lows and lower highs, and the price closed below the previous high.
Dark Red: Heiken Ashi candle closed red, but had a higher low or higher high (trend weakening).
Optional: I included a setting for allowing high RSI values to overrule Heiken Ashi values (disabled by default).
This kind of indicator is best used for managing open positions rather than entering trades. It works on all timeframes and instruments.
Feel free to contact me if you have any questions :)
Regards,
- Matt
PS. Here's a snapshot of it against a Heiken Ashi chart for reference:
リリースノート
Added -1 offset value to trend strength bars so that they align properly with candles.リリースノート
- Turned RSI override on by default to improve trend strength signal accuracy.リリースノート
Added ability to reference higher timeframeリリースノート
Removed HTF functionality as repainting issues were creating problems.Indicator no longer repaints, and only uses the current timeframe data for signals.
リリースノート
-- Converted to Pine Script version 4
- Several minor code improvements & optimizations
- Added candle offset (0 = use current bar data, 1 = use previous bar data)
リリースノート
Updated to Pine Script v5リリースノート
Updated to pine script v6オープンソーススクリプト
TradingViewの精神に則り、このスクリプトの作者はコードをオープンソースとして公開してくれました。トレーダーが内容を確認・検証できるようにという配慮です。作者に拍手を送りましょう!無料で利用できますが、コードの再公開はハウスルールに従う必要があります。
My Resources Hub: theartoftrading.com
FREE YouTube Lessons: rebrand.ly/zyt
FREE Pine Script Basics Course: rebrand.ly/zpsbc
Pine Script MASTERY Course: rebrand.ly/zpsmc
My Indicators & Strategies: rebrand.ly/zmisc
FREE YouTube Lessons: rebrand.ly/zyt
FREE Pine Script Basics Course: rebrand.ly/zpsbc
Pine Script MASTERY Course: rebrand.ly/zpsmc
My Indicators & Strategies: rebrand.ly/zmisc
免責事項
この情報および投稿は、TradingViewが提供または推奨する金融、投資、トレード、その他のアドバイスや推奨を意図するものではなく、それらを構成するものでもありません。詳細は利用規約をご覧ください。
オープンソーススクリプト
TradingViewの精神に則り、このスクリプトの作者はコードをオープンソースとして公開してくれました。トレーダーが内容を確認・検証できるようにという配慮です。作者に拍手を送りましょう!無料で利用できますが、コードの再公開はハウスルールに従う必要があります。
My Resources Hub: theartoftrading.com
FREE YouTube Lessons: rebrand.ly/zyt
FREE Pine Script Basics Course: rebrand.ly/zpsbc
Pine Script MASTERY Course: rebrand.ly/zpsmc
My Indicators & Strategies: rebrand.ly/zmisc
FREE YouTube Lessons: rebrand.ly/zyt
FREE Pine Script Basics Course: rebrand.ly/zpsbc
Pine Script MASTERY Course: rebrand.ly/zpsmc
My Indicators & Strategies: rebrand.ly/zmisc
免責事項
この情報および投稿は、TradingViewが提供または推奨する金融、投資、トレード、その他のアドバイスや推奨を意図するものではなく、それらを構成するものでもありません。詳細は利用規約をご覧ください。