INVITE-ONLY SCRIPT
[astropark] Cumulative Volume Delta (CVD)
アップデート済
Dear Followers,
today another awesome Analysis Tool, that you can use in your trading journey: Cumulative Volume Delta (CVD), also known as Cumulative Delta Volume (CDV)!
Volume says a lot about price action:
The Cumulative Volume Delta measures the effectiveness of buyers and sellers' actions, so basically if the volume they generate with their buy and sell market orders is effective on price or not.
When it's not effective, a divergence appears and we, as traders, can profit from it.
Here some examples how you can use the indicator by spotting divergences between price and cumulative volume delta.
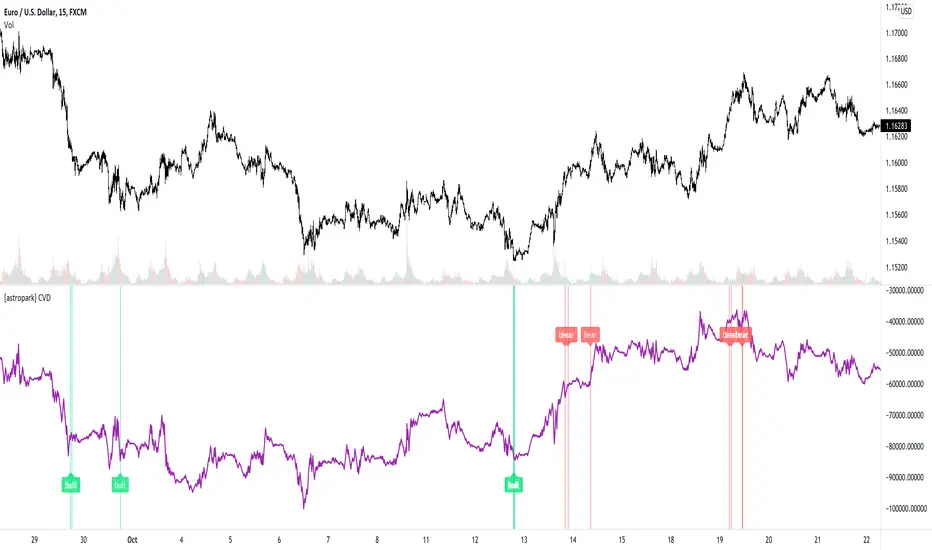
EURUSD, 15m
sellers trying hard to make price fall, but volume is lacking on CVD (exhaustion): bullish divergence

EURUSD, 15m
buyers trying hard to make price go up, but volume is lacking on CVD (exhaustion): many bearish divergences

SPX500, 15m
buyers exhaustion: bearish divergence

XAUUSD, 15m
sellers exhaustion: bullish divergences

XAGUSD, 15m
buyers exhaustion: bearish divergence

BTCUSD, 15m
buyers exhaustion: bearish divergence (in red)
buyers absorbed sellers' pressure: hidden bullish divergence (in green)

BTCUSD, 15m
inefficiency by buyers: higher and higher buy volume but it's not effective on price (sellers absorbed): hidden bearish divergence (in blue)
sellers exhaustion: bullish divergences (in green)
buyers exhaustion: bearish divergence (in red)

ETHBTC, 15m
buyers exhaustion: bearish divergence (in red)
inefficiency by sellers: higher and higher sell volume but it's not effective on price (buyers absorbed): hidden bullish divergence (in blue)

TSLA, 15m
inefficiency by sellers, sellers pressure absorbed by buyers: hidden bullish divergence (in blue)
buyers exhaustion: bearish divergence (in red)
sellers exhaustion: bullish divergence (in green)
inefficiency by buyers, sellers pressure absorbed by sellers: hidden bearish divergence (in fuchsia)

This indicator works on every timeframe, market and pair, by the way must be said that it works best on 15m and 5m timeframes, as you can have access to a more detailed volume information.
As I always say, all tools are great if you use them correctly: this is not the "Holy Grail", so always use proper money and risk management strategies.
This is a premium indicator, so send me a private message in order to get access to this script.
today another awesome Analysis Tool, that you can use in your trading journey: Cumulative Volume Delta (CVD), also known as Cumulative Delta Volume (CDV)!
Volume says a lot about price action:
- price drops with low volume? or price pumps but no volume increase?
- big sellers volume but price does not drop? or big buyers volume but price does not increase?
The Cumulative Volume Delta measures the effectiveness of buyers and sellers' actions, so basically if the volume they generate with their buy and sell market orders is effective on price or not.
When it's not effective, a divergence appears and we, as traders, can profit from it.
Here some examples how you can use the indicator by spotting divergences between price and cumulative volume delta.
EURUSD, 15m
sellers trying hard to make price fall, but volume is lacking on CVD (exhaustion): bullish divergence
EURUSD, 15m
buyers trying hard to make price go up, but volume is lacking on CVD (exhaustion): many bearish divergences
SPX500, 15m
buyers exhaustion: bearish divergence
XAUUSD, 15m
sellers exhaustion: bullish divergences
XAGUSD, 15m
buyers exhaustion: bearish divergence
BTCUSD, 15m
buyers exhaustion: bearish divergence (in red)
buyers absorbed sellers' pressure: hidden bullish divergence (in green)
BTCUSD, 15m
inefficiency by buyers: higher and higher buy volume but it's not effective on price (sellers absorbed): hidden bearish divergence (in blue)
sellers exhaustion: bullish divergences (in green)
buyers exhaustion: bearish divergence (in red)
ETHBTC, 15m
buyers exhaustion: bearish divergence (in red)
inefficiency by sellers: higher and higher sell volume but it's not effective on price (buyers absorbed): hidden bullish divergence (in blue)
TSLA, 15m
inefficiency by sellers, sellers pressure absorbed by buyers: hidden bullish divergence (in blue)
buyers exhaustion: bearish divergence (in red)
sellers exhaustion: bullish divergence (in green)
inefficiency by buyers, sellers pressure absorbed by sellers: hidden bearish divergence (in fuchsia)
This indicator works on every timeframe, market and pair, by the way must be said that it works best on 15m and 5m timeframes, as you can have access to a more detailed volume information.
As I always say, all tools are great if you use them correctly: this is not the "Holy Grail", so always use proper money and risk management strategies.
This is a premium indicator, so send me a private message in order to get access to this script.
リリースノート
From now on, the indicator will calculate divergences for you, both regular and hidden ones. Of course you can set alerts over them.You can customize colors and choose to hide the CVD plot in order to place the indicator in overlay on the chart to better see where divergences are found.
Divergences analysis window is set to 500 by default: the higher the number, the less divergences will be found, while the lower the number, the higher the number of divergences displayed.
Also source code has upgraded to pine script v5.
招待専用スクリプト
このスクリプトへのアクセスは作者が許可したユーザーに制限されており、通常はお支払いが必要です。お気に入りに追加することはできますが、許可を申請して作者が許可した後でなければ使用することはできません。 詳細については astropark にお問い合わせいただくか、以下の作者の指示に従ってください。
スクリプトの動作を理解していて作者も100%信頼できるということでなければ、TradingViewとしてはお金を払ってまでスクリプトを利用するのはお勧めしません。そのかわりに、コミュニティスクリプトでオープンソースの優れたスクリプトが無料で見つけられることが多々あります。
作者の指示
″This is a premium indicator I developed, so send me a private message in order to get access to this script.
チャートでこのスクリプトを利用したいですか?
注: アクセス権をリクエストされる前にこちらをご覧ください。
I'm a software engineer, passionate for trading & developing trading tools & bots! Feel free to DM me & checkout my work: bit.ly/astroparktrading
免責事項
これらの情報および投稿は、TradingViewが提供または保証する金融、投資、取引、またはその他の種類のアドバイスや推奨を意図したものではなく、またそのようなものでもありません。詳しくは利用規約をご覧ください。